Seasonal outlook
How the outlook verifies
Every season since FMA 2012, scored after it ended against what was observed in each climate division, beside NOAA’s outlooks scored the same way.
Skill compared with NOAA
173 seasons, FMA 2012 to JJA 2026. The skill score is the ranked probability skill score against climatology: it uses every probability at every division, 0 is no better than climatology, and higher is better.
| Temperature skill | Ours vs. | Precipitation skill | Ours vs. | |
|---|---|---|---|---|
| Amphibian | 19.8 | 6.3 | ||
| NOAA Climate Prediction Center | 13.3 | +49% | 2.4 | +165% |
| NOAA multi-model ensemble (NMME) | 16.8 | +18% | 3.2 | +98% |
The Amphibian outlook has the highest skill score of the three for both temperature and precipitation. It gives guidance over far more of the country: a favored category over 84% of the map for temperature and 68% for precipitation, where NOAA’s Climate Prediction Center outlook covers 50% and 21% and leaves the rest at climatological odds. For precipitation, the hardest variable to forecast, it matches NOAA’s accuracy (49%) while covering about three times as much of the map. NOAA’s more selective temperature outlooks have been somewhat more accurate where they commit (65%, against our 60%). Like every seasonal outlook, ours gives odds, not certainties: a favored category is more likely, not guaranteed.
Are the probabilities honest?
When the outlook gave the favored tercile a given probability, how often that tercile was observed. A well-calibrated forecast lands in its own range.
| Forecast probability | Temperature: happened | Precipitation: happened |
|---|---|---|
| 40–50% | 53% | 47% |
| 50–60% | 62% | 54% |
| 60–70% | 70% | 57% |
| 70% or more | 77% | 51% |
Our temperature odds have been conservative: when the outlook gave the favored category 40–50%, it happened 53% of the time (NOAA CPC: 61%). Precipitation odds have been on target at 40–50%, the range used over about half the map, and a little high above 60%, which is rare.
Season by season
Accuracy by season: where the outlook favored above, near or below normal, the share of that area where it was observed (random guessing scores 33%). Select a season to see its outlook beside NOAA’s and what was observed.
Temperature
Precipitation
JJA 2026 issued May 2026
Temperature: 93% accurate, opposite extreme 0% (NOAA CPC 100%, 0%)
Precipitation: 40% accurate, opposite extreme 21% (NOAA CPC 31%, 38%)
Temperature
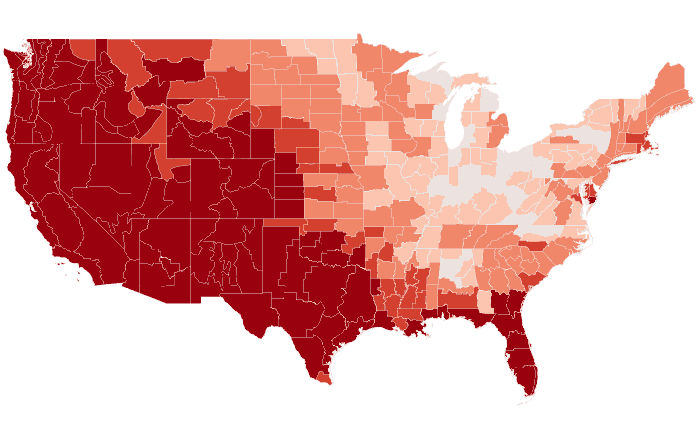

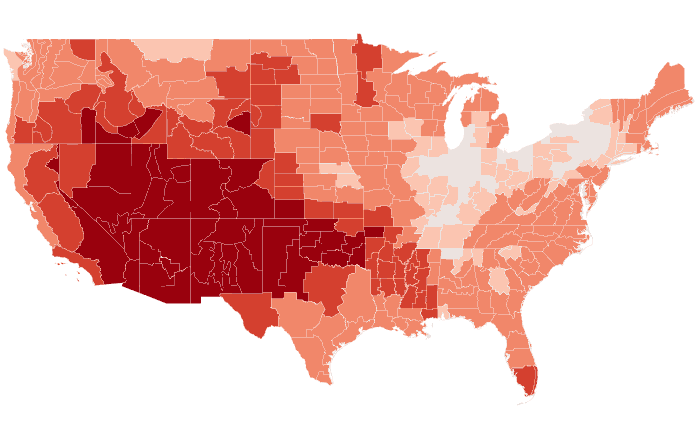
Outlooks
Probability of the favored tercile: 40, 50, 60, 70%+
Observed
Departure from normal: steps at ±0.5, 1, 2, 3°F
Precipitation
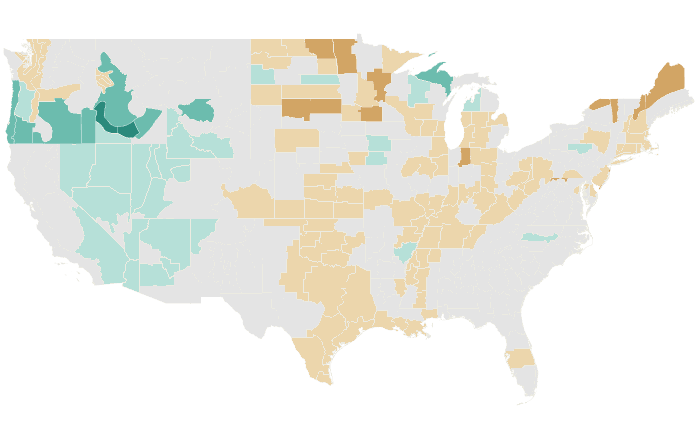
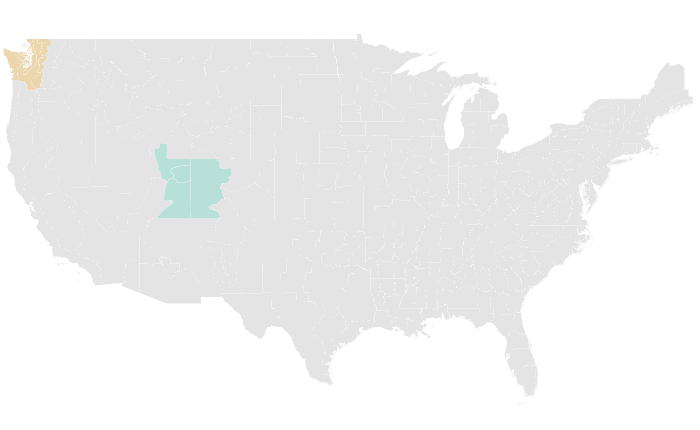

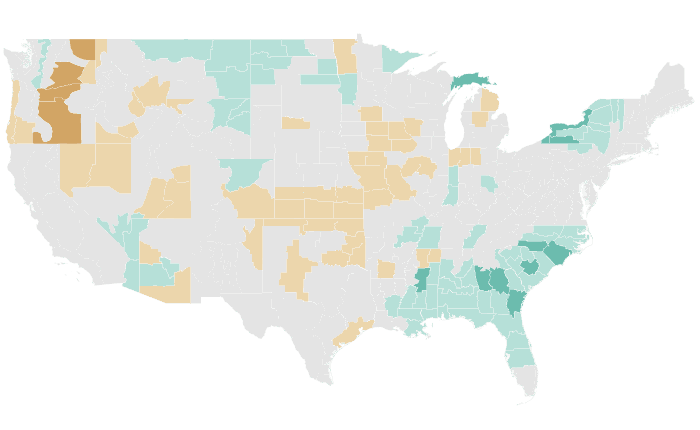
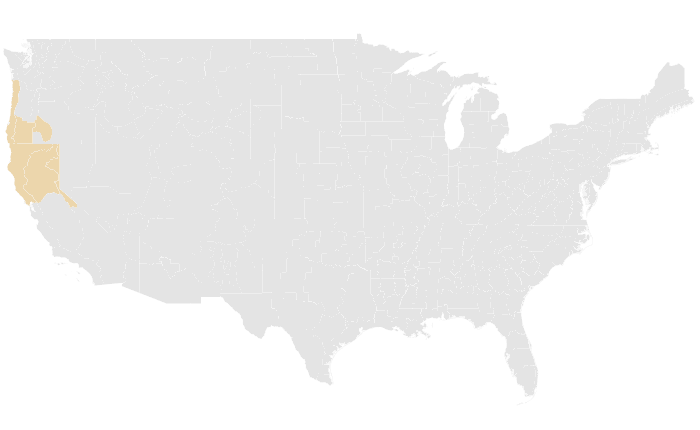
Outlooks
Probability of the favored tercile: 40, 50, 60, 70%+
Observed
Percent of normal: steps at 50, 70, 80, 90, 110, 120, 130, 150%
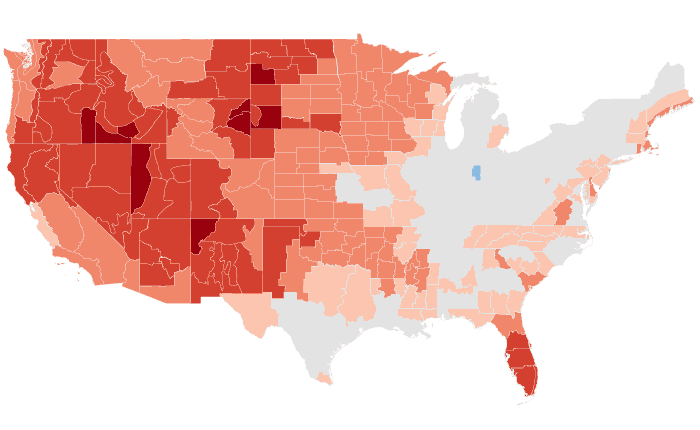
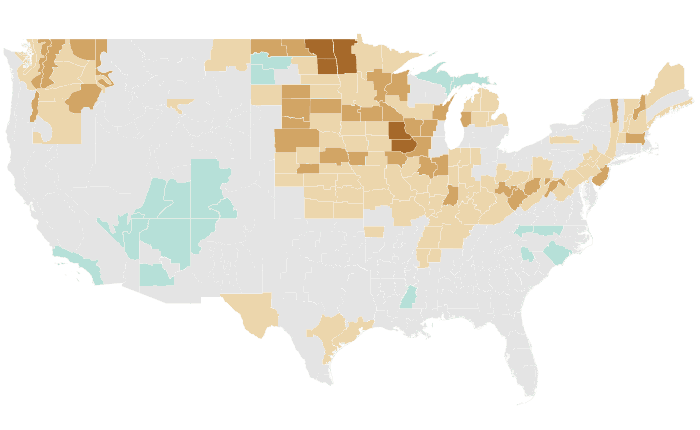
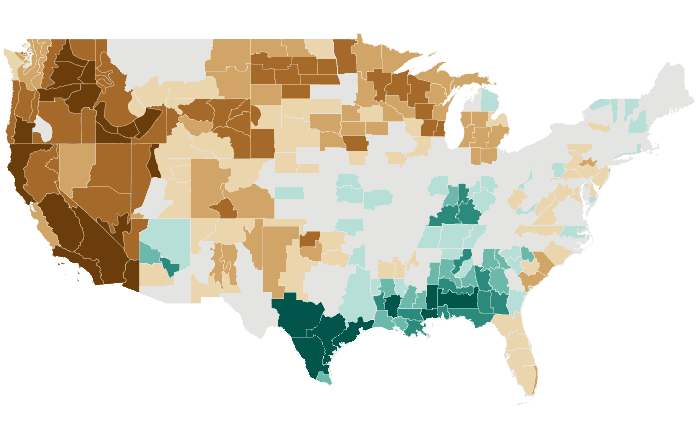
MJJ 2026 issued April 2026
Temperature: 79% accurate, opposite extreme 1% (NOAA CPC 84%, 0%)
Precipitation: 42% accurate, opposite extreme 17% (NOAA CPC 62%, 14%)
Temperature


Outlooks
Probability of the favored tercile: 40, 50, 60, 70%+
Observed
Departure from normal: steps at ±0.5, 1, 2, 3°F
Precipitation

Outlooks
Probability of the favored tercile: 40, 50, 60, 70%+
Observed
Percent of normal: steps at 50, 70, 80, 90, 110, 120, 130, 150%
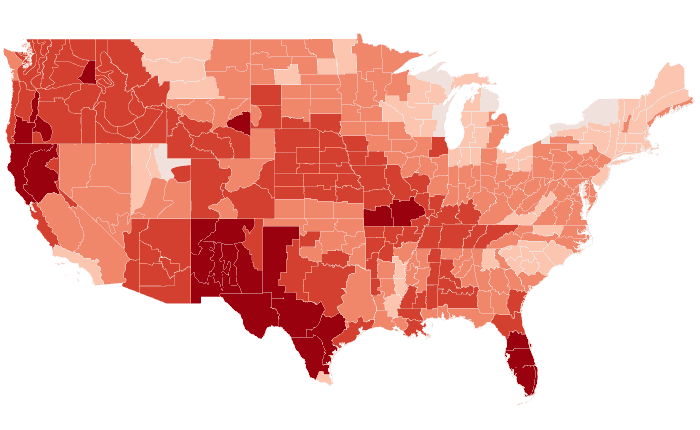
AMJ 2026 issued March 2026
Temperature: 84% accurate, opposite extreme 0% (NOAA CPC 91%, 0%)
Precipitation: 42% accurate, opposite extreme 24% (NOAA CPC 79%, 0%)
Temperature

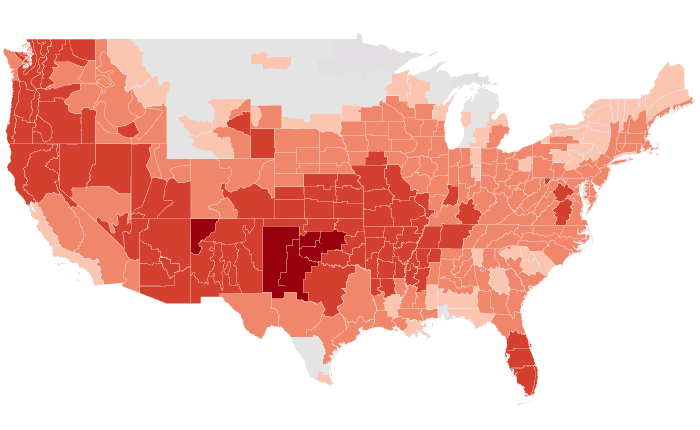
Outlooks
Probability of the favored tercile: 40, 50, 60, 70%+
Observed
Departure from normal: steps at ±0.5, 1, 2, 3°F
Precipitation
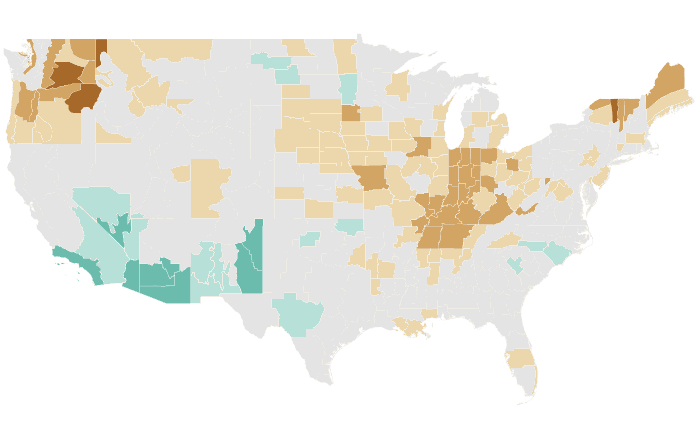
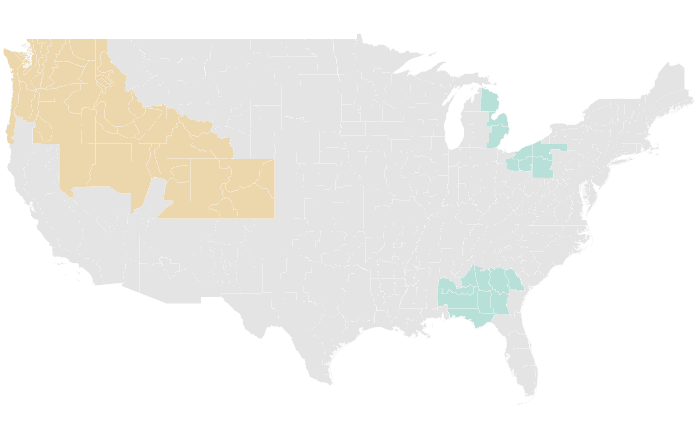
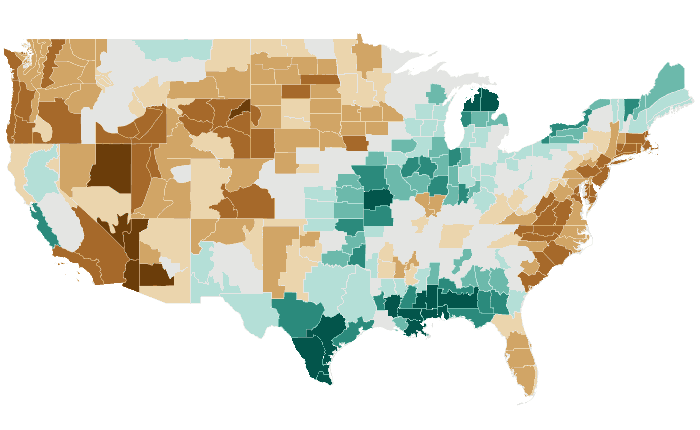
Outlooks
Probability of the favored tercile: 40, 50, 60, 70%+
Observed
Percent of normal: steps at 50, 70, 80, 90, 110, 120, 130, 150%
MAM 2026 issued February 2026
Temperature: 96% accurate, opposite extreme 0% (NOAA CPC 100%, 0%)
Precipitation: 38% accurate, opposite extreme 21% (NOAA CPC 87%, 0%)
Temperature
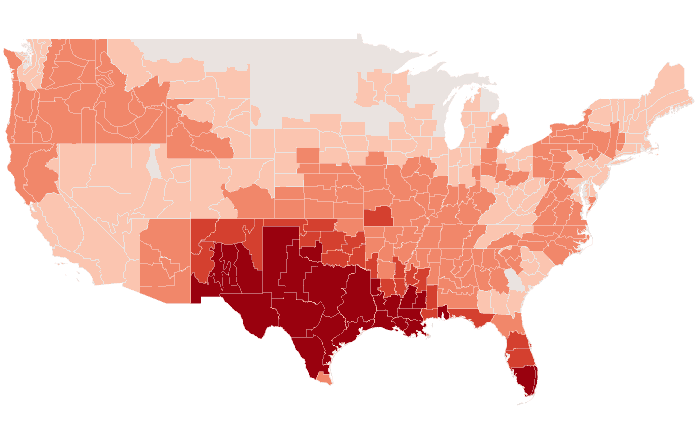

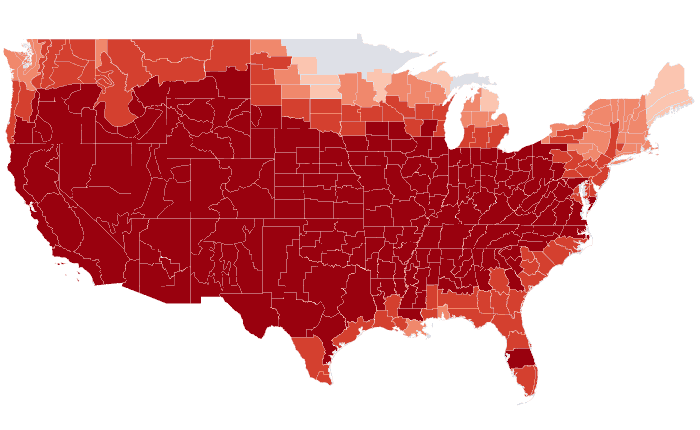
Outlooks
Probability of the favored tercile: 40, 50, 60, 70%+
Observed
Departure from normal: steps at ±0.5, 1, 2, 3°F
Precipitation


Outlooks
Probability of the favored tercile: 40, 50, 60, 70%+
Observed
Percent of normal: steps at 50, 70, 80, 90, 110, 120, 130, 150%
FMA 2026 issued January 2026
Temperature: 87% accurate, opposite extreme 3% (NOAA CPC 87%, 10%)
Precipitation: 47% accurate, opposite extreme 21% (NOAA CPC 73%, 8%)
Temperature


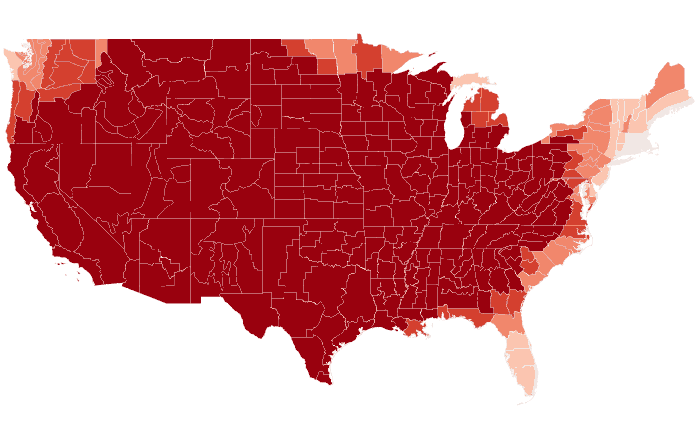
Outlooks
Probability of the favored tercile: 40, 50, 60, 70%+
Observed
Departure from normal: steps at ±0.5, 1, 2, 3°F
Precipitation
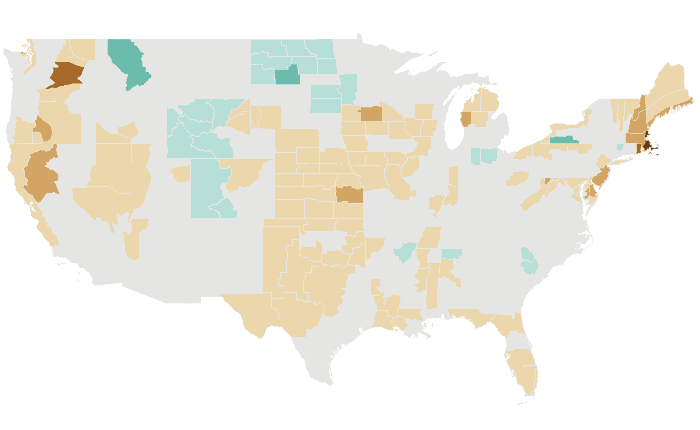

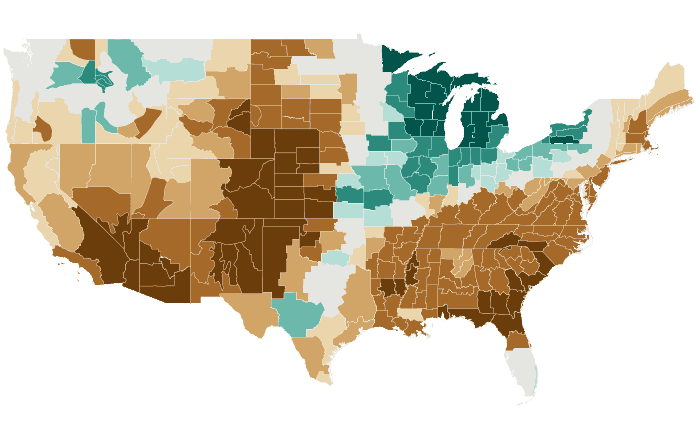
Outlooks
Probability of the favored tercile: 40, 50, 60, 70%+
Observed
Percent of normal: steps at 50, 70, 80, 90, 110, 120, 130, 150%
JFM 2026 issued December 2025
Temperature: 70% accurate, opposite extreme 7% (NOAA CPC 69%, 19%)
Precipitation: 43% accurate, opposite extreme 20% (NOAA CPC 40%, 29%)
Temperature

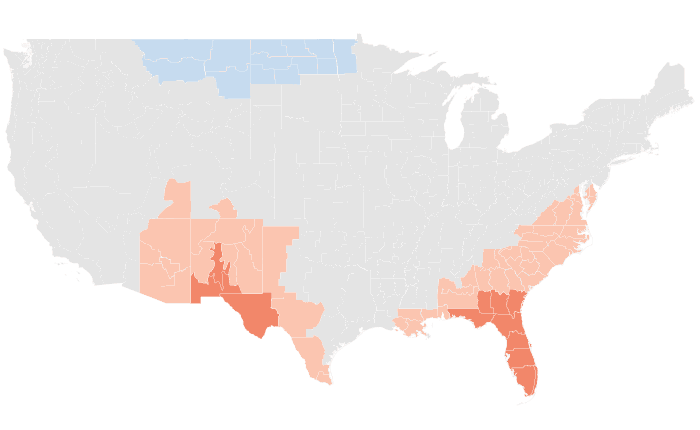
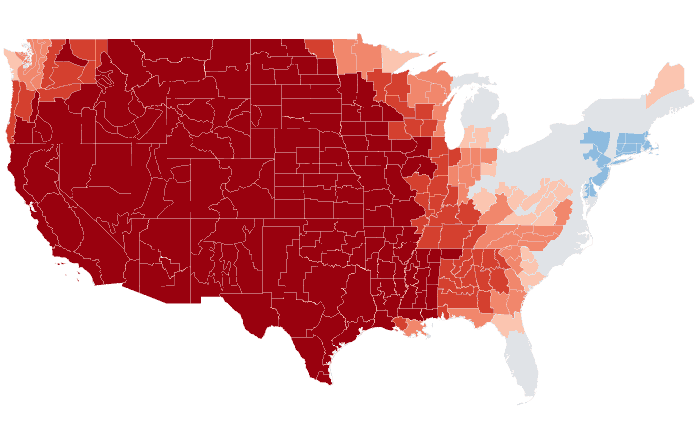
Outlooks
Probability of the favored tercile: 40, 50, 60, 70%+
Observed
Departure from normal: steps at ±0.5, 1, 2, 3°F
Precipitation
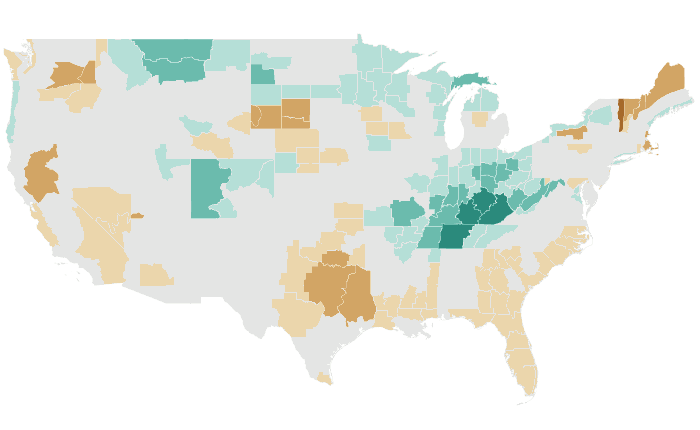

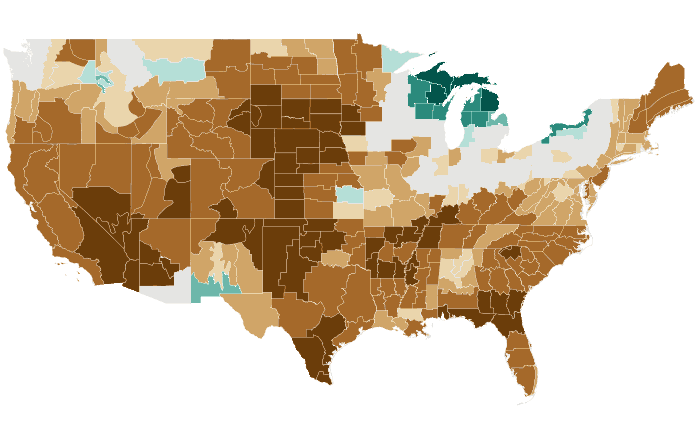
Outlooks
Probability of the favored tercile: 40, 50, 60, 70%+
Observed
Percent of normal: steps at 50, 70, 80, 90, 110, 120, 130, 150%
DJF 2025-26 issued November 2025
Temperature: 60% accurate, opposite extreme 9% (NOAA CPC 45%, 30%)
Precipitation: 58% accurate, opposite extreme 13% (NOAA CPC 56%, 19%)
Temperature

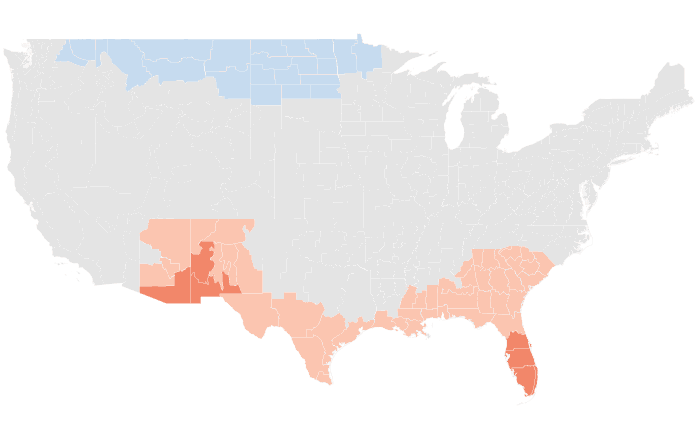

Outlooks
Probability of the favored tercile: 40, 50, 60, 70%+
Observed
Departure from normal: steps at ±0.5, 1, 2, 3°F
Precipitation
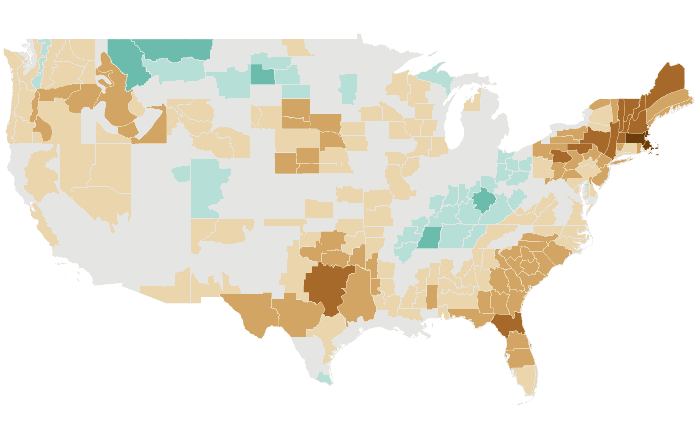


Outlooks
Probability of the favored tercile: 40, 50, 60, 70%+
Observed
Percent of normal: steps at 50, 70, 80, 90, 110, 120, 130, 150%
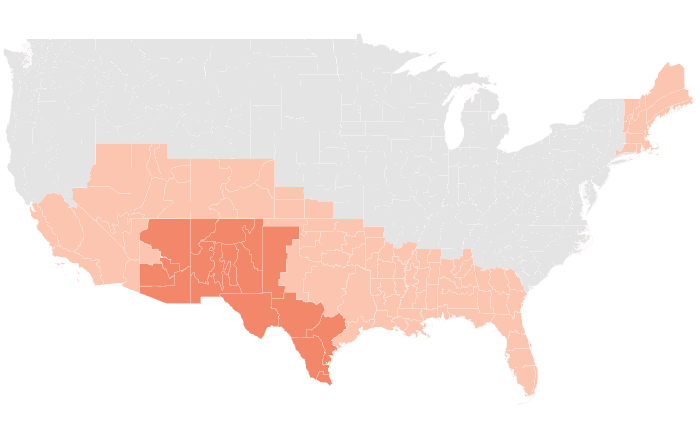
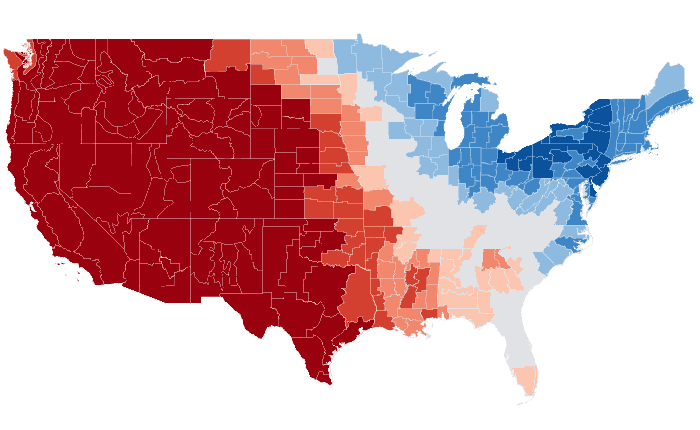
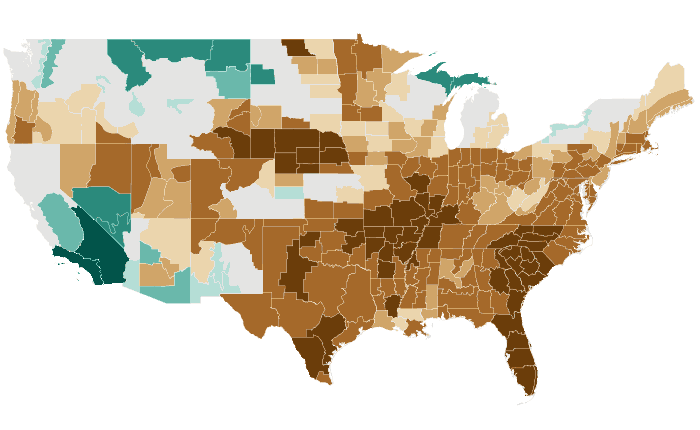
NDJ 2025-26 issued October 2025
Temperature: 67% accurate, opposite extreme 7% (NOAA CPC 84%, 4%)
Precipitation: 59% accurate, opposite extreme 6% (NOAA CPC 55%, 13%)
Temperature
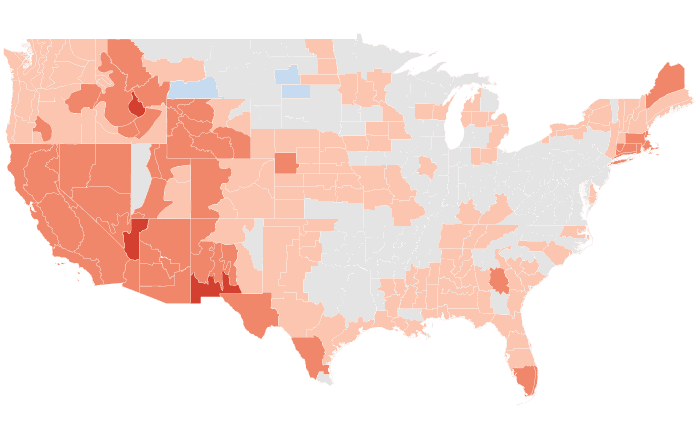
Outlooks
Probability of the favored tercile: 40, 50, 60, 70%+
Observed
Departure from normal: steps at ±0.5, 1, 2, 3°F
Precipitation


Outlooks
Probability of the favored tercile: 40, 50, 60, 70%+
Observed
Percent of normal: steps at 50, 70, 80, 90, 110, 120, 130, 150%
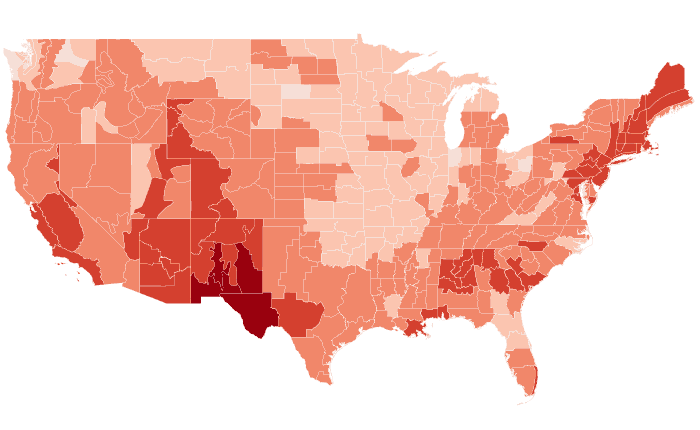
OND 2025 issued September 2025
Temperature: 80% accurate, opposite extreme 6% (NOAA CPC 78%, 10%)
Precipitation: 66% accurate, opposite extreme 9% (NOAA CPC 65%, 7%)
Temperature


Outlooks
Probability of the favored tercile: 40, 50, 60, 70%+
Observed
Departure from normal: steps at ±0.5, 1, 2, 3°F
Precipitation
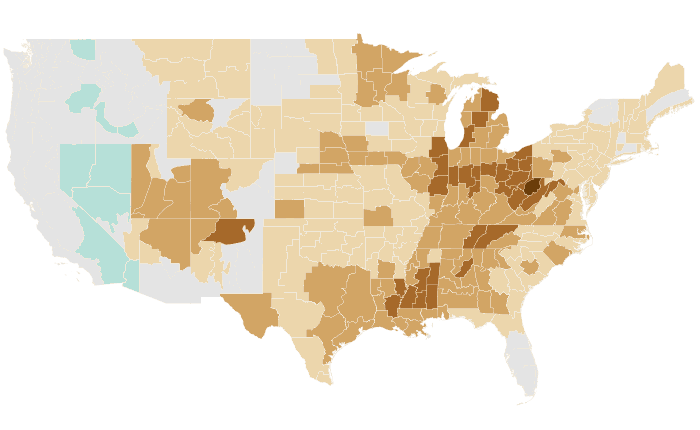
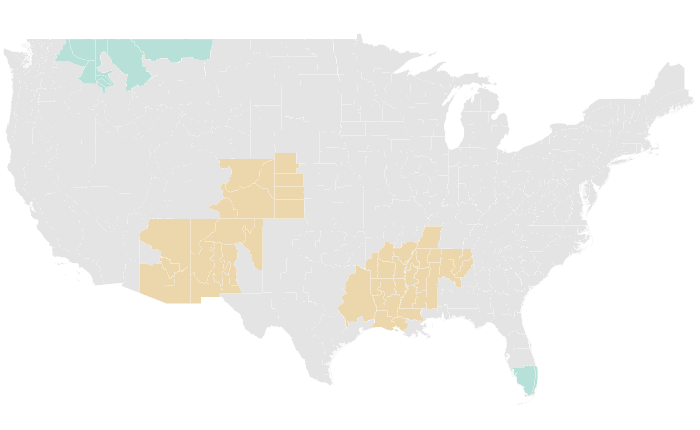

Outlooks
Probability of the favored tercile: 40, 50, 60, 70%+
Observed
Percent of normal: steps at 50, 70, 80, 90, 110, 120, 130, 150%
SON 2025 issued August 2025
Temperature: 85% accurate, opposite extreme 0% (NOAA CPC 83%, 0%)
Precipitation: 56% accurate, opposite extreme 12% (NOAA CPC 11%, 43%)
Temperature

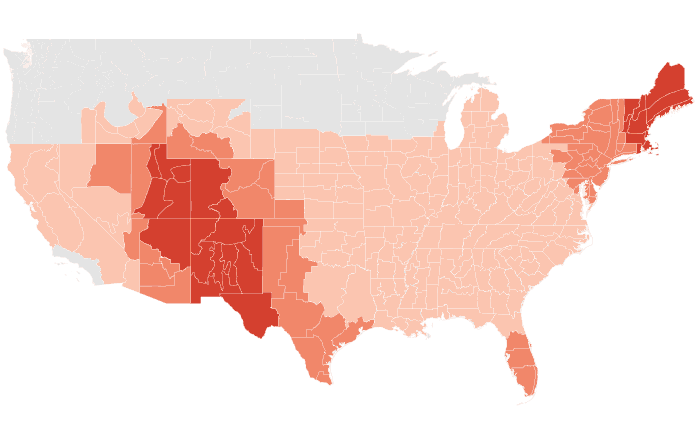
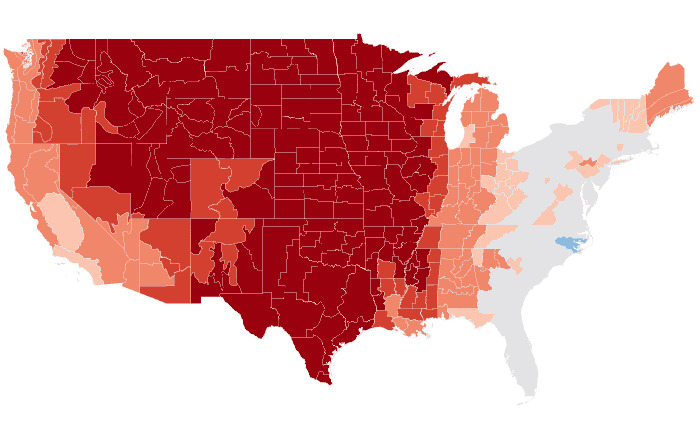
Outlooks
Probability of the favored tercile: 40, 50, 60, 70%+
Observed
Departure from normal: steps at ±0.5, 1, 2, 3°F
Precipitation

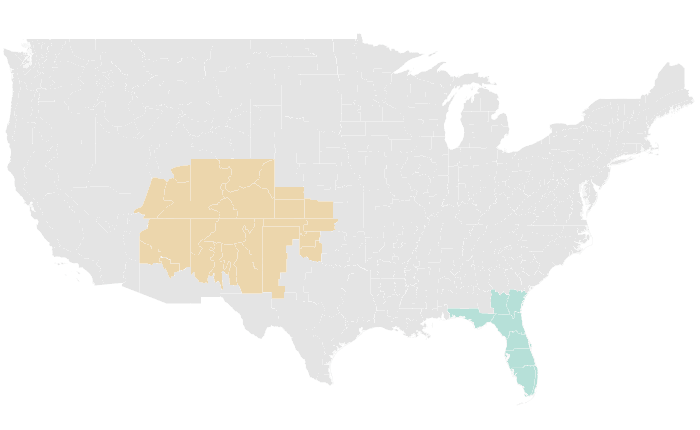

Outlooks
Probability of the favored tercile: 40, 50, 60, 70%+
Observed
Percent of normal: steps at 50, 70, 80, 90, 110, 120, 130, 150%
ASO 2025 issued July 2025
Temperature: 83% accurate, opposite extreme 4% (NOAA CPC 79%, 5%)
Precipitation: 44% accurate, opposite extreme 21% (NOAA CPC 3%, 62%)
Temperature

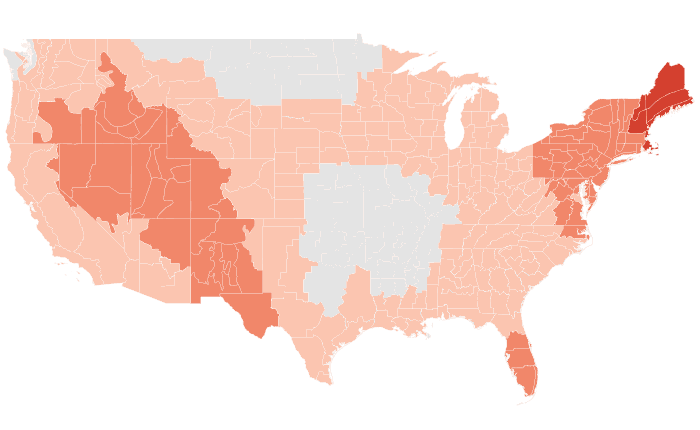
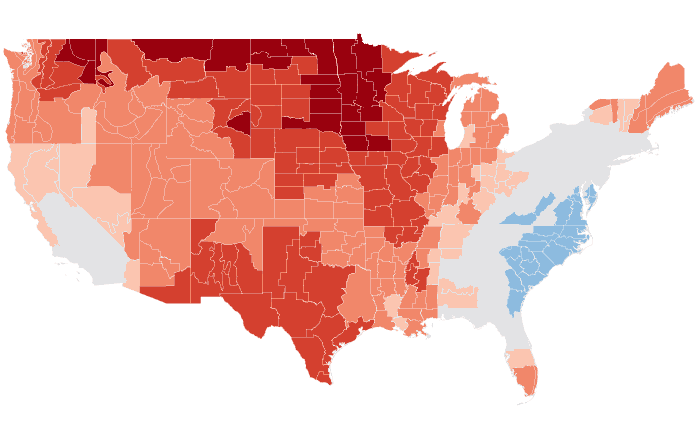
Outlooks
Probability of the favored tercile: 40, 50, 60, 70%+
Observed
Departure from normal: steps at ±0.5, 1, 2, 3°F
Precipitation
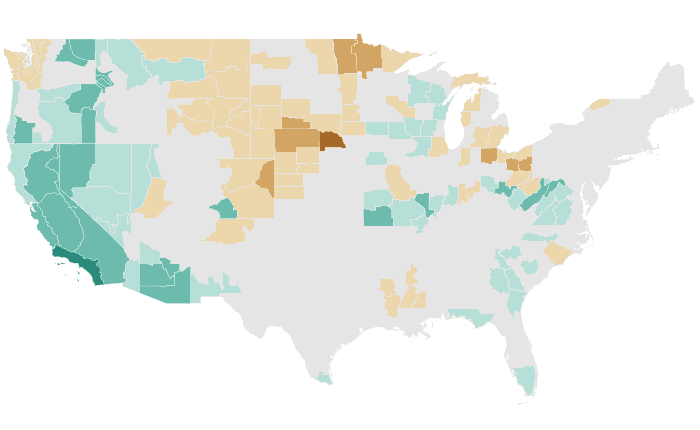


Outlooks
Probability of the favored tercile: 40, 50, 60, 70%+
Observed
Percent of normal: steps at 50, 70, 80, 90, 110, 120, 130, 150%
JAS 2025 issued June 2025
Temperature: 73% accurate, opposite extreme 0% (NOAA CPC 75%, 1%)
Precipitation: 28% accurate, opposite extreme 46% (NOAA CPC 5%, 59%)
Temperature


Outlooks
Probability of the favored tercile: 40, 50, 60, 70%+
Observed
Departure from normal: steps at ±0.5, 1, 2, 3°F
Precipitation
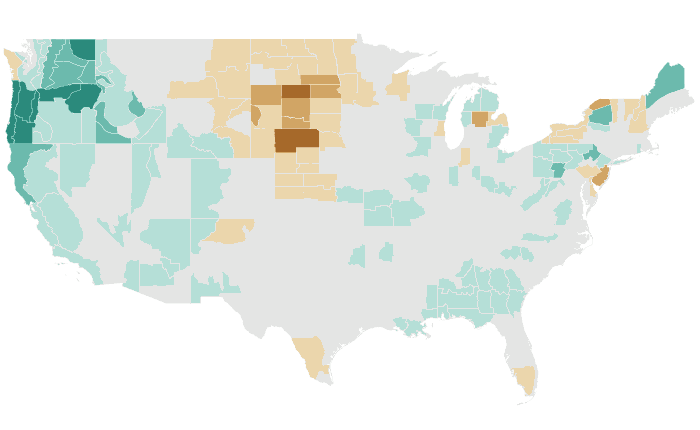


Outlooks
Probability of the favored tercile: 40, 50, 60, 70%+
Observed
Percent of normal: steps at 50, 70, 80, 90, 110, 120, 130, 150%
JJA 2025 issued May 2025
Temperature: 56% accurate, opposite extreme 2% (NOAA CPC 62%, 0%)
Precipitation: 29% accurate, opposite extreme 31% (NOAA CPC 36%, 25%)
Temperature
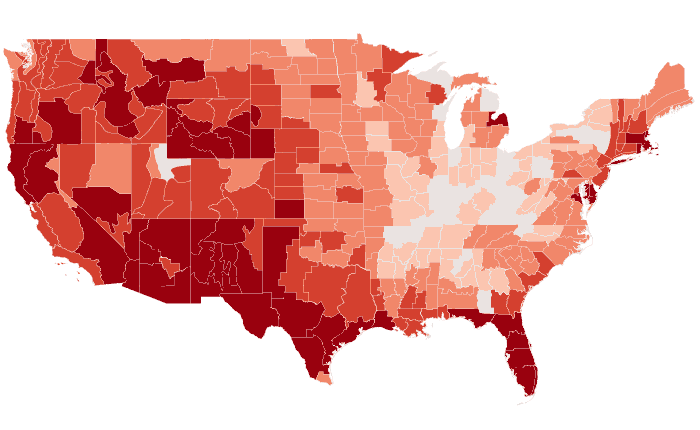
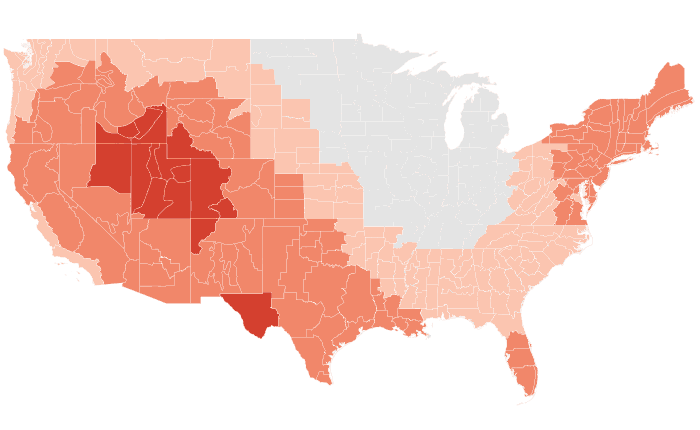
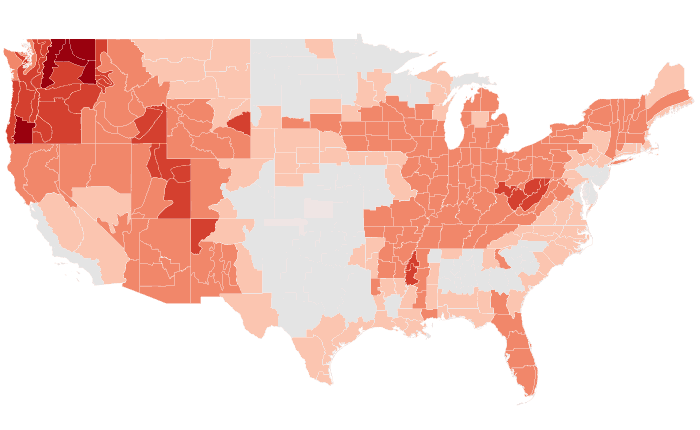
Outlooks
Probability of the favored tercile: 40, 50, 60, 70%+
Observed
Departure from normal: steps at ±0.5, 1, 2, 3°F
Precipitation


Outlooks
Probability of the favored tercile: 40, 50, 60, 70%+
Observed
Percent of normal: steps at 50, 70, 80, 90, 110, 120, 130, 150%
MJJ 2025 issued April 2025
Temperature: 65% accurate, opposite extreme 4% (NOAA CPC 72%, 6%)
Precipitation: 30% accurate, opposite extreme 36% (NOAA CPC 62%, 12%)
Temperature
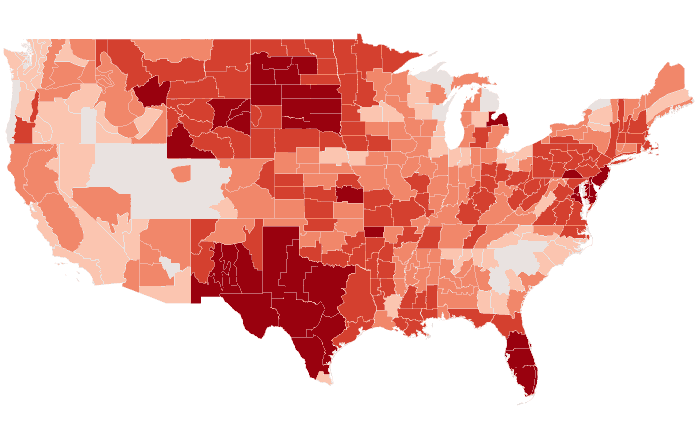
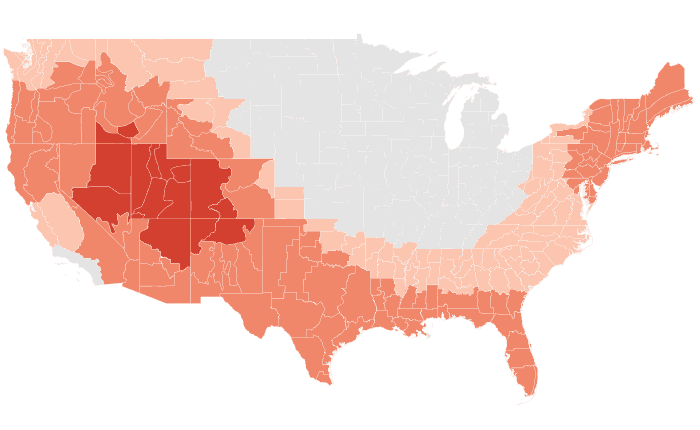
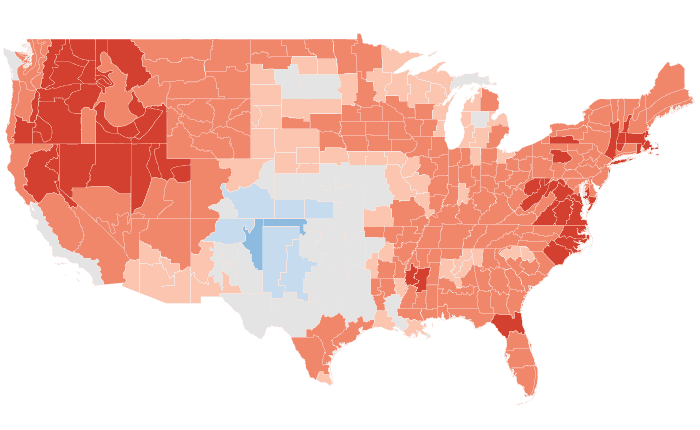
Outlooks
Probability of the favored tercile: 40, 50, 60, 70%+
Observed
Departure from normal: steps at ±0.5, 1, 2, 3°F
Precipitation
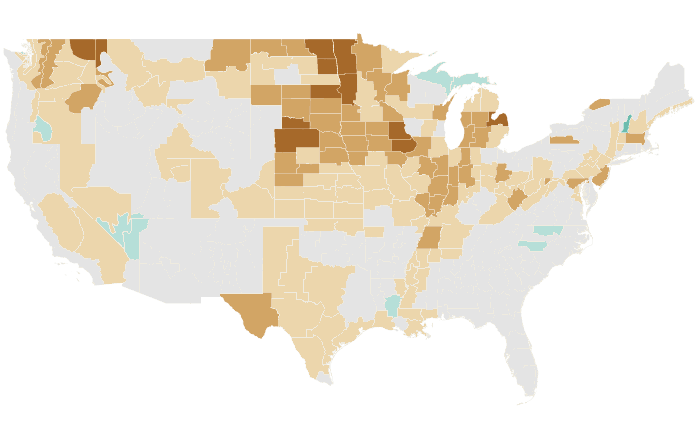
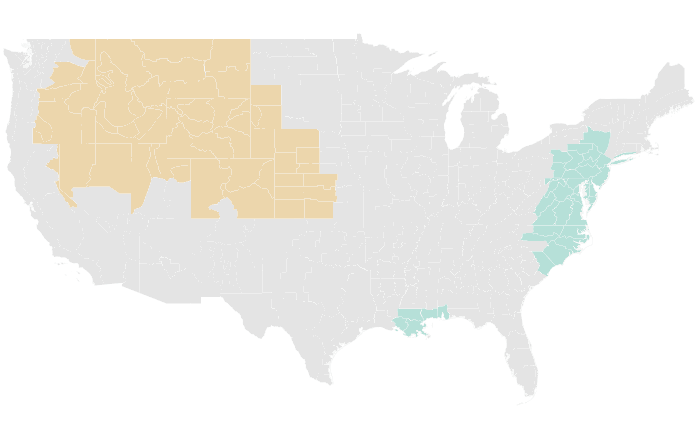

Outlooks
Probability of the favored tercile: 40, 50, 60, 70%+
Observed
Percent of normal: steps at 50, 70, 80, 90, 110, 120, 130, 150%
AMJ 2025 issued March 2025
Temperature: 73% accurate, opposite extreme 0% (NOAA CPC 81%, 1%)
Precipitation: 40% accurate, opposite extreme 24% (NOAA CPC 38%, 30%)
Temperature
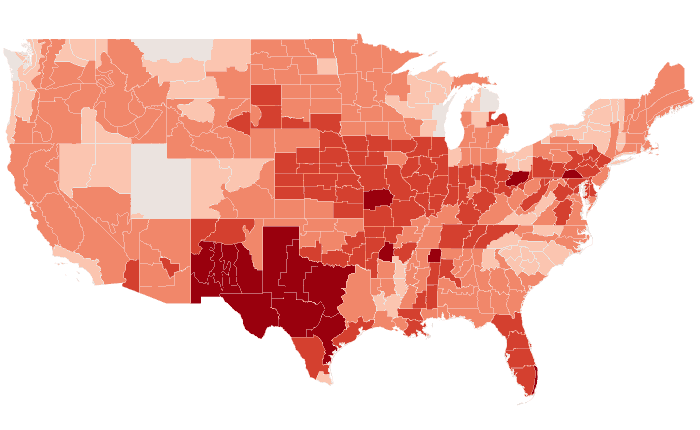
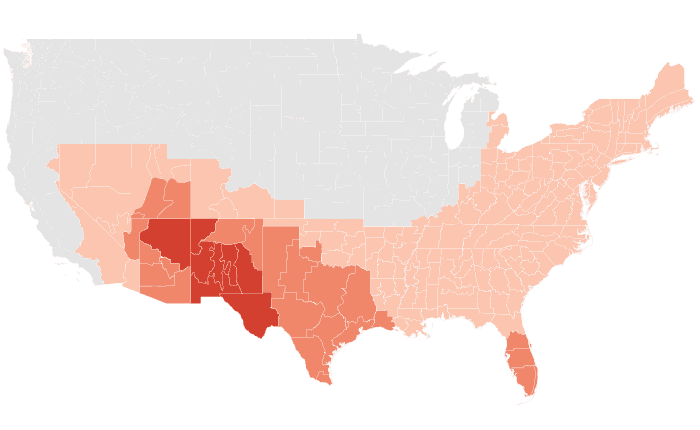
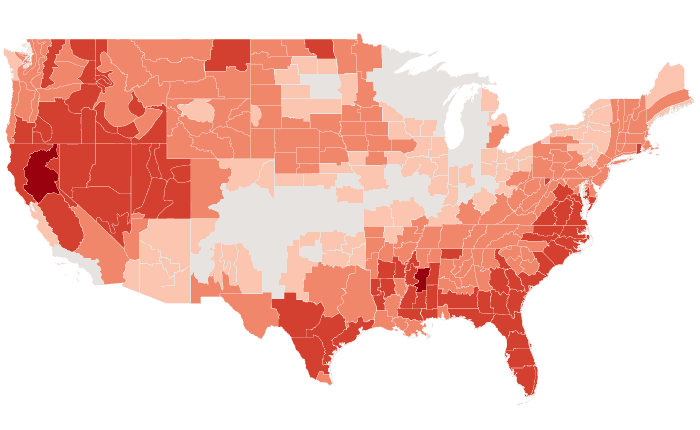
Outlooks
Probability of the favored tercile: 40, 50, 60, 70%+
Observed
Departure from normal: steps at ±0.5, 1, 2, 3°F
Precipitation


Outlooks
Probability of the favored tercile: 40, 50, 60, 70%+
Observed
Percent of normal: steps at 50, 70, 80, 90, 110, 120, 130, 150%
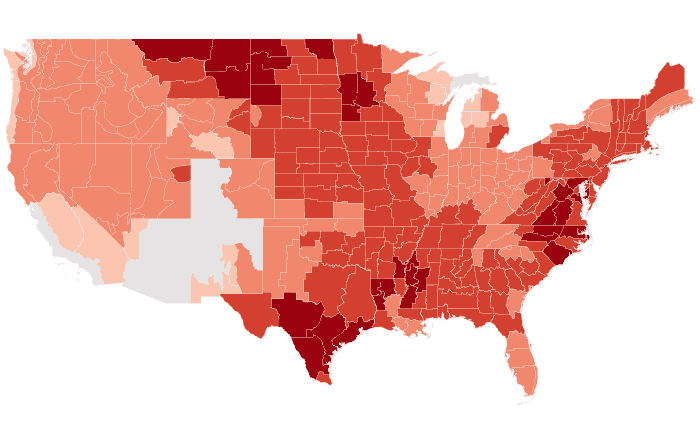
MAM 2025 issued February 2025
Temperature: 76% accurate, opposite extreme 5% (NOAA CPC 73%, 10%)
Precipitation: 31% accurate, opposite extreme 34% (NOAA CPC 35%, 18%)
Temperature
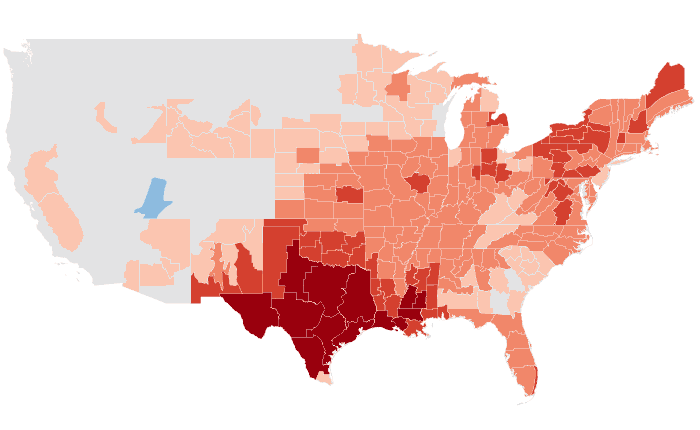
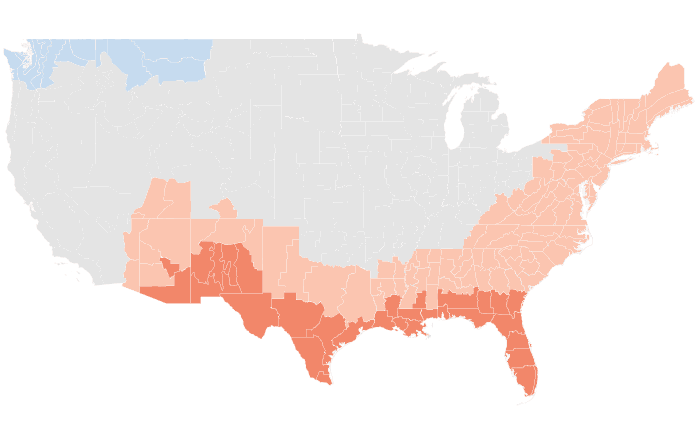
Outlooks
Probability of the favored tercile: 40, 50, 60, 70%+
Observed
Departure from normal: steps at ±0.5, 1, 2, 3°F
Precipitation
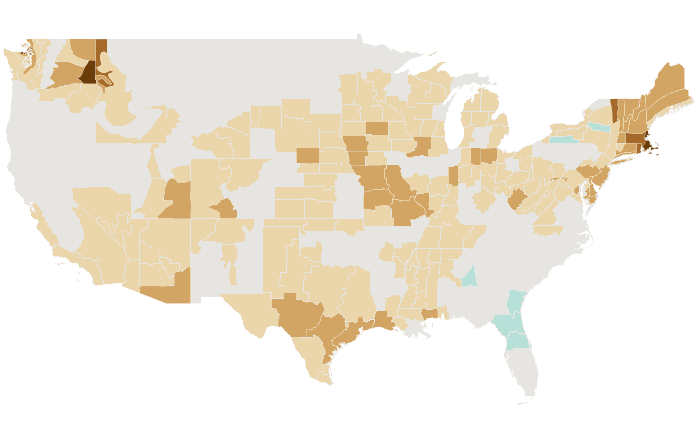
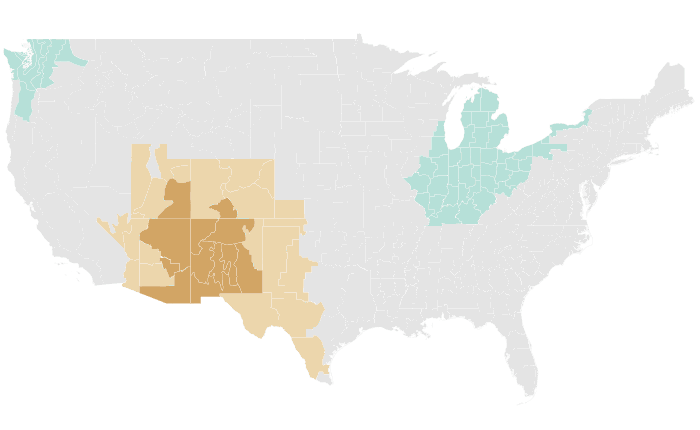

Outlooks
Probability of the favored tercile: 40, 50, 60, 70%+
Observed
Percent of normal: steps at 50, 70, 80, 90, 110, 120, 130, 150%
FMA 2025 issued January 2025
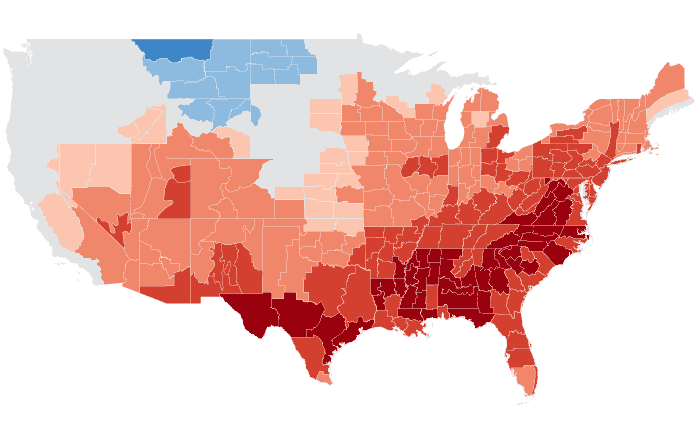
Temperature: 85% accurate, opposite extreme 0% (NOAA CPC 86%, 0%)
Precipitation: 49% accurate, opposite extreme 10% (NOAA CPC 62%, 4%)
Temperature

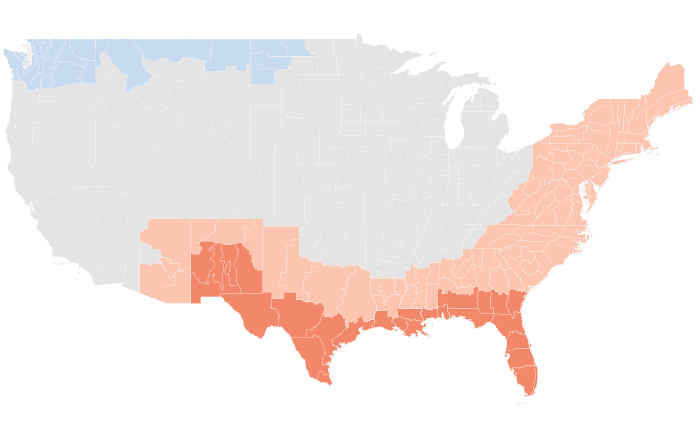
Outlooks
Probability of the favored tercile: 40, 50, 60, 70%+
Observed
Departure from normal: steps at ±0.5, 1, 2, 3°F
Precipitation

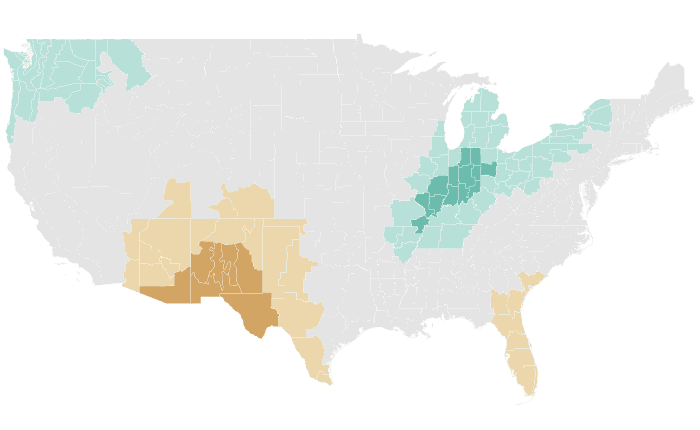
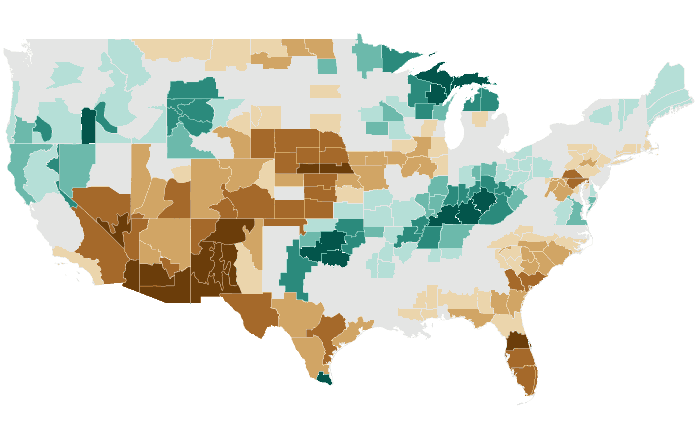
Outlooks
Probability of the favored tercile: 40, 50, 60, 70%+
Observed
Percent of normal: steps at 50, 70, 80, 90, 110, 120, 130, 150%
JFM 2025 issued December 2024
Temperature: 28% accurate, opposite extreme 7% (NOAA CPC 21%, 1%)
Precipitation: 41% accurate, opposite extreme 11% (NOAA CPC 59%, 16%)
Temperature

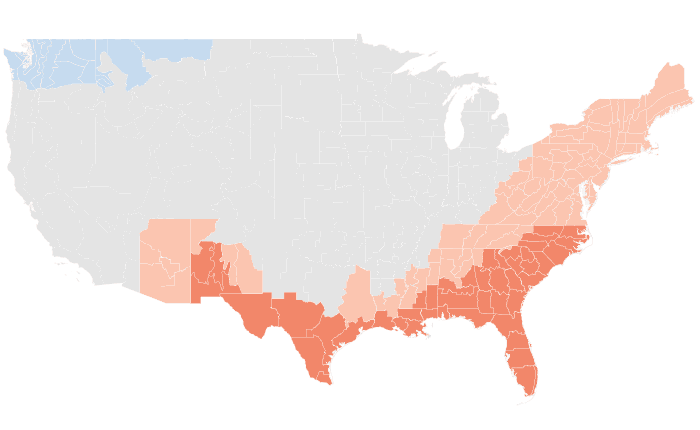
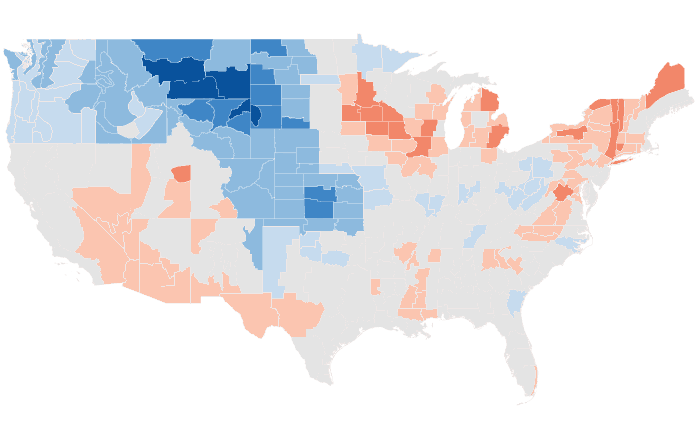
Outlooks
Probability of the favored tercile: 40, 50, 60, 70%+
Observed
Departure from normal: steps at ±0.5, 1, 2, 3°F
Precipitation


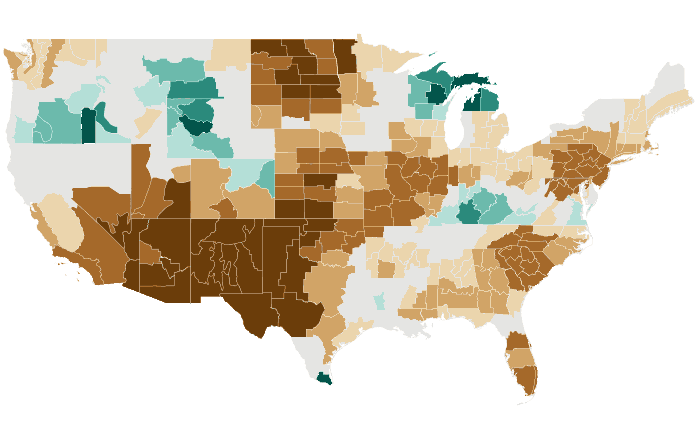
Outlooks
Probability of the favored tercile: 40, 50, 60, 70%+
Observed
Percent of normal: steps at 50, 70, 80, 90, 110, 120, 130, 150%
DJF 2024-25 issued November 2024
Temperature: 51% accurate, opposite extreme 10% (NOAA CPC 29%, 15%)
Precipitation: 49% accurate, opposite extreme 12% (NOAA CPC 63%, 12%)
Temperature
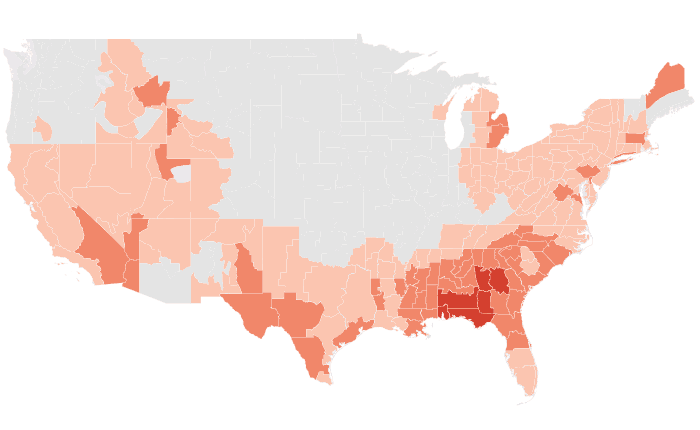
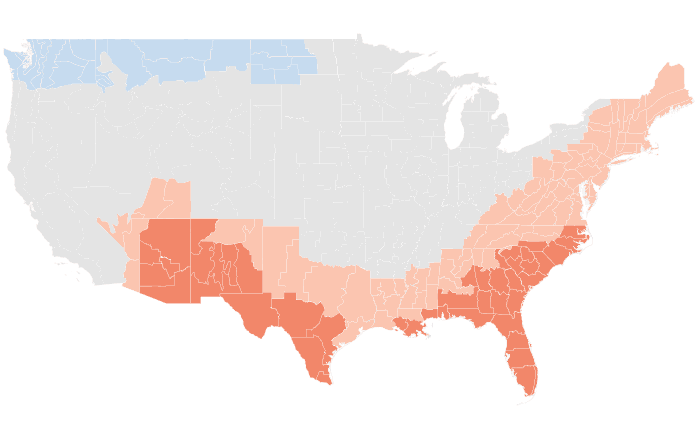

Outlooks
Probability of the favored tercile: 40, 50, 60, 70%+
Observed
Departure from normal: steps at ±0.5, 1, 2, 3°F
Precipitation
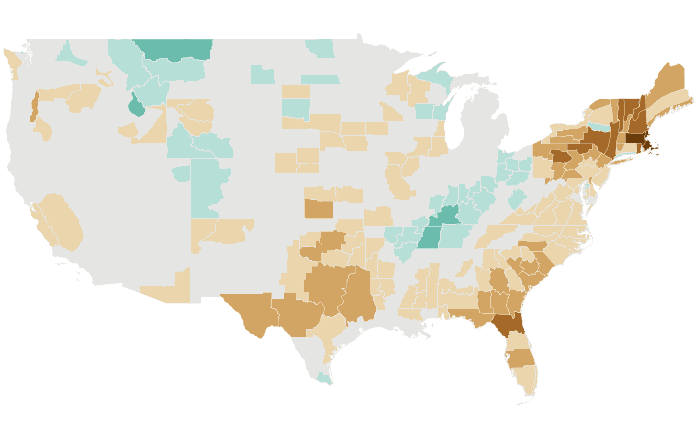

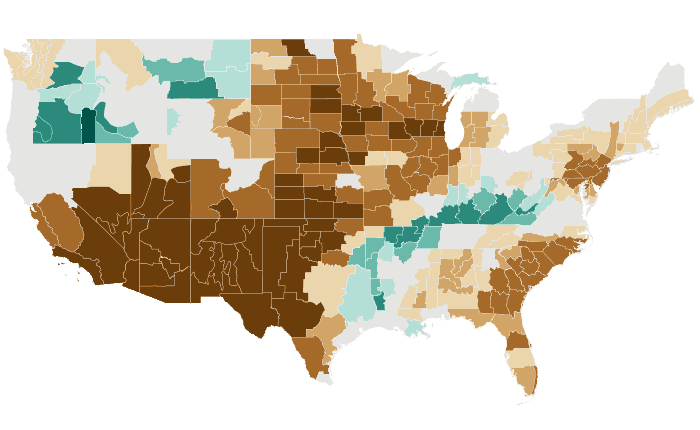
Outlooks
Probability of the favored tercile: 40, 50, 60, 70%+
Observed
Percent of normal: steps at 50, 70, 80, 90, 110, 120, 130, 150%
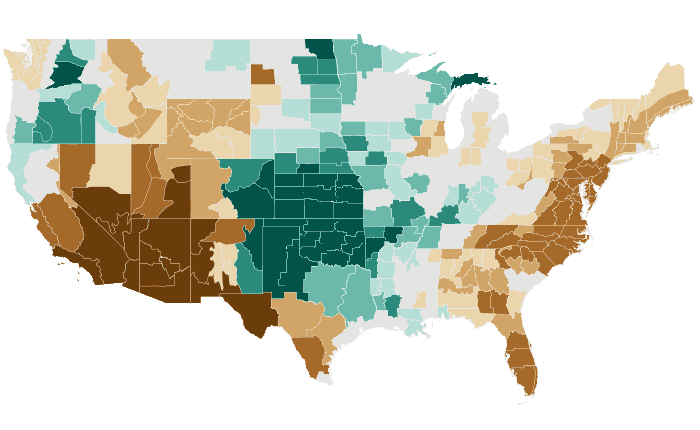
NDJ 2024-25 issued October 2024
Temperature: 46% accurate, opposite extreme 6% (NOAA CPC 41%, 7%)
Precipitation: 46% accurate, opposite extreme 16% (NOAA CPC 40%, 37%)
Temperature


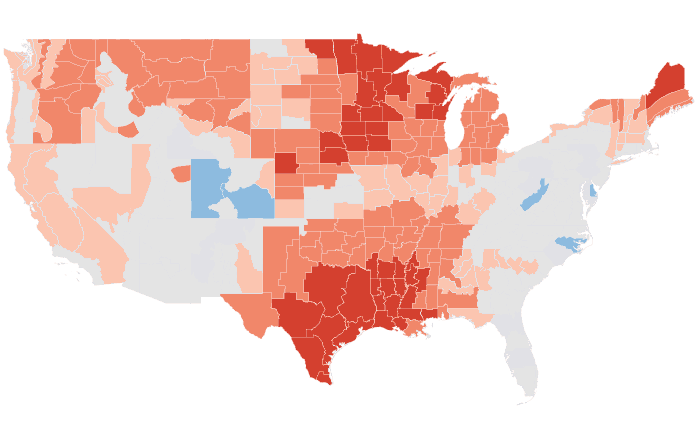
Outlooks
Probability of the favored tercile: 40, 50, 60, 70%+
Observed
Departure from normal: steps at ±0.5, 1, 2, 3°F
Precipitation


Outlooks
Probability of the favored tercile: 40, 50, 60, 70%+
Observed
Percent of normal: steps at 50, 70, 80, 90, 110, 120, 130, 150%
OND 2024 issued September 2024
Temperature: 99% accurate, opposite extreme 0% (NOAA CPC 99%, 0%)
Precipitation: 50% accurate, opposite extreme 17% (NOAA CPC 47%, 30%)
Temperature
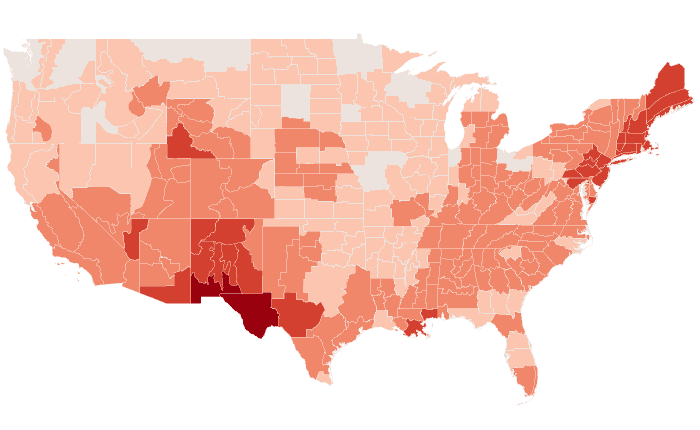
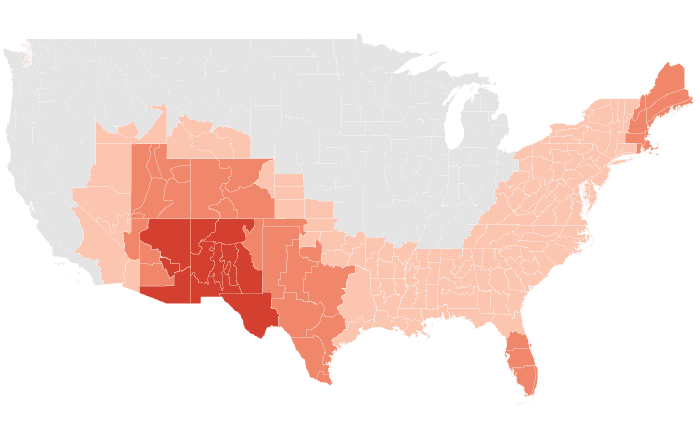

Outlooks
Probability of the favored tercile: 40, 50, 60, 70%+
Observed
Departure from normal: steps at ±0.5, 1, 2, 3°F
Precipitation

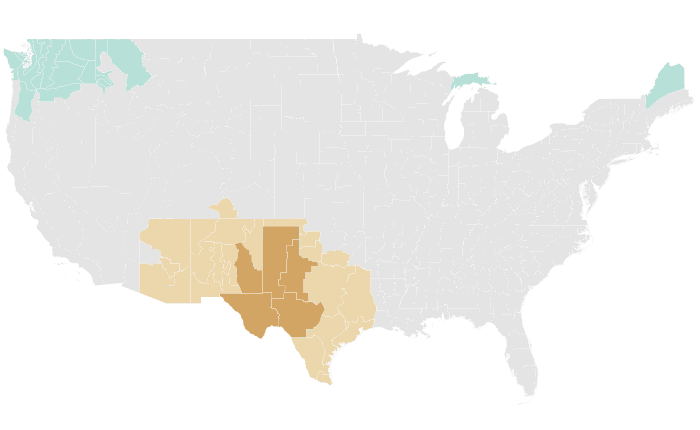
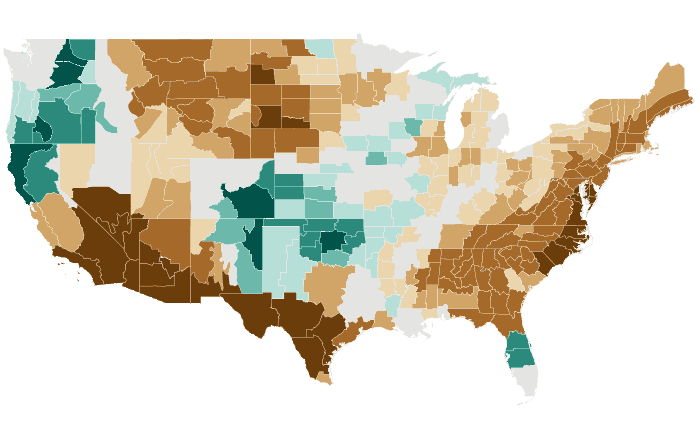
Outlooks
Probability of the favored tercile: 40, 50, 60, 70%+
Observed
Percent of normal: steps at 50, 70, 80, 90, 110, 120, 130, 150%
SON 2024 issued August 2024
Temperature: 98% accurate, opposite extreme 0% (NOAA CPC 98%, 0%)
Precipitation: 55% accurate, opposite extreme 18% (NOAA CPC 33%, 41%)
Temperature

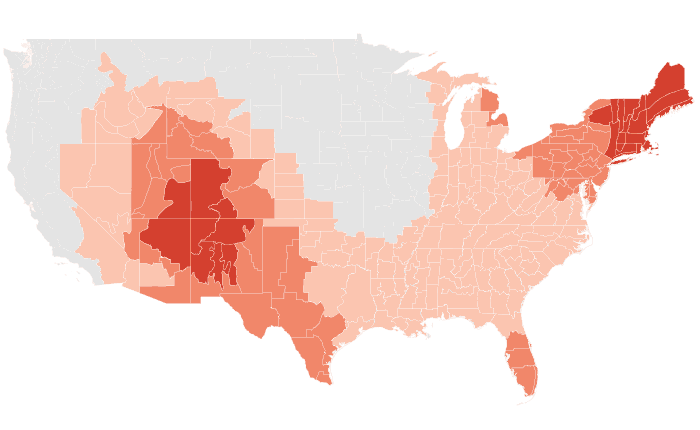
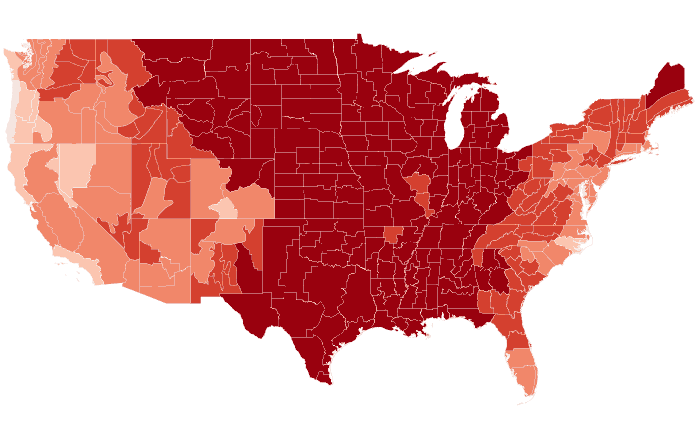
Outlooks
Probability of the favored tercile: 40, 50, 60, 70%+
Observed
Departure from normal: steps at ±0.5, 1, 2, 3°F
Precipitation


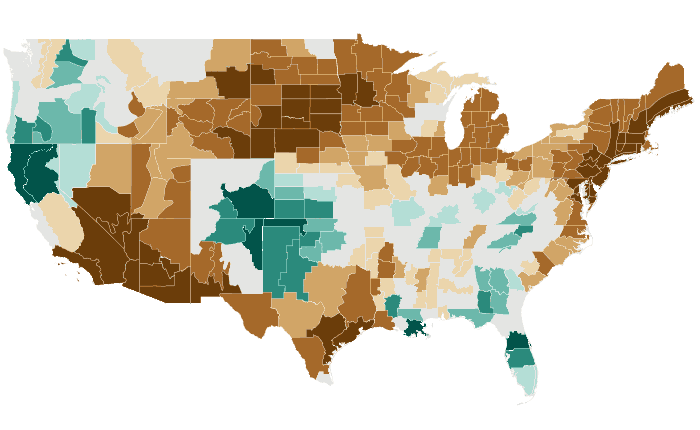
Outlooks
Probability of the favored tercile: 40, 50, 60, 70%+
Observed
Percent of normal: steps at 50, 70, 80, 90, 110, 120, 130, 150%
ASO 2024 issued July 2024
Temperature: 97% accurate, opposite extreme 0% (NOAA CPC 95%, 0%)
Precipitation: 47% accurate, opposite extreme 25% (NOAA CPC 47%, 25%)
Temperature


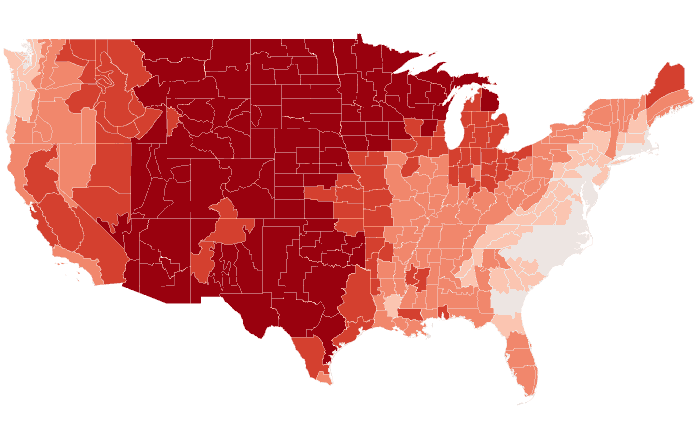
Outlooks
Probability of the favored tercile: 40, 50, 60, 70%+
Observed
Departure from normal: steps at ±0.5, 1, 2, 3°F
Precipitation
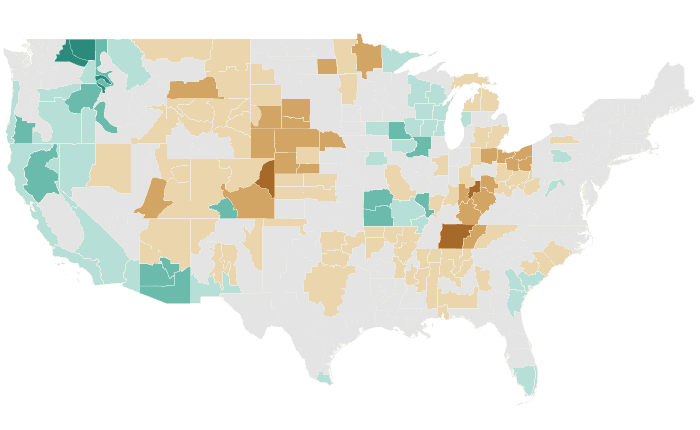

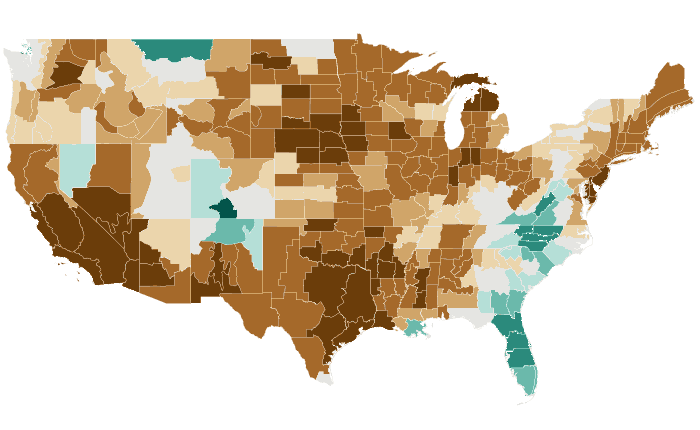
Outlooks
Probability of the favored tercile: 40, 50, 60, 70%+
Observed
Percent of normal: steps at 50, 70, 80, 90, 110, 120, 130, 150%
JAS 2024 issued June 2024
Temperature: 81% accurate, opposite extreme 0% (NOAA CPC 79%, 0%)
Precipitation: 36% accurate, opposite extreme 25% (NOAA CPC 58%, 10%)
Temperature


Outlooks
Probability of the favored tercile: 40, 50, 60, 70%+
Observed
Departure from normal: steps at ±0.5, 1, 2, 3°F
Precipitation
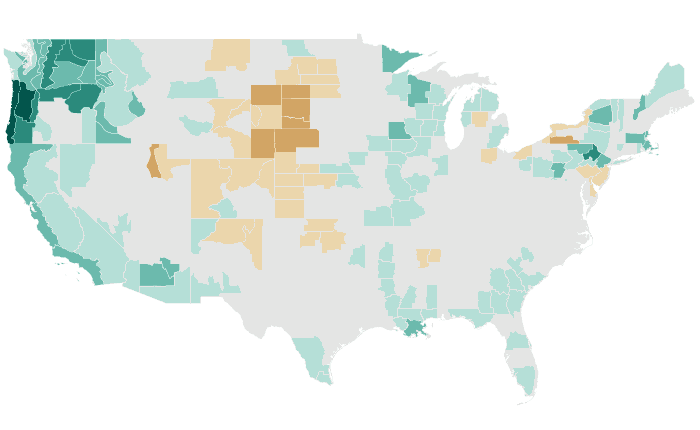

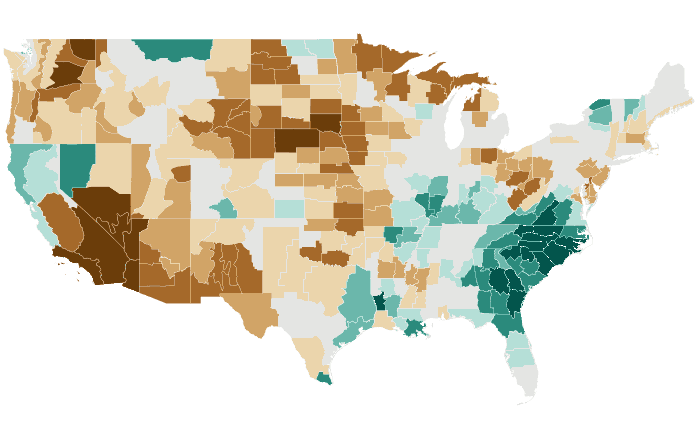
Outlooks
Probability of the favored tercile: 40, 50, 60, 70%+
Observed
Percent of normal: steps at 50, 70, 80, 90, 110, 120, 130, 150%
JJA 2024 issued May 2024
Temperature: 70% accurate, opposite extreme 0% (NOAA CPC 91%, 0%)
Precipitation: 40% accurate, opposite extreme 33% (NOAA CPC 50%, 27%)
Temperature


Outlooks
Probability of the favored tercile: 40, 50, 60, 70%+
Observed
Departure from normal: steps at ±0.5, 1, 2, 3°F
Precipitation


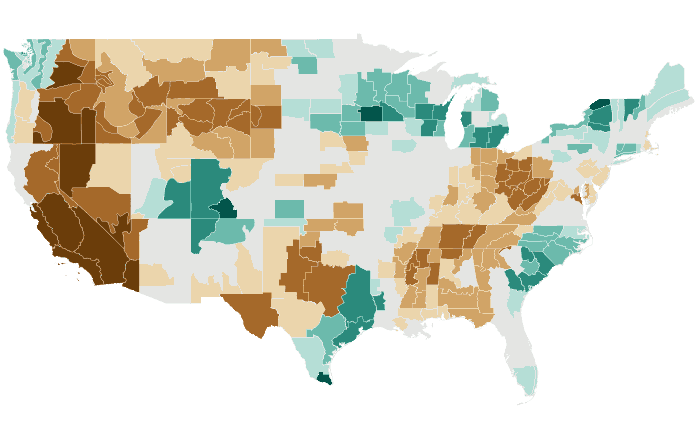
Outlooks
Probability of the favored tercile: 40, 50, 60, 70%+
Observed
Percent of normal: steps at 50, 70, 80, 90, 110, 120, 130, 150%
MJJ 2024 issued April 2024
Temperature: 67% accurate, opposite extreme 0% (NOAA CPC 84%, 0%)
Precipitation: 32% accurate, opposite extreme 35% (NOAA CPC 50%, 13%)
Temperature

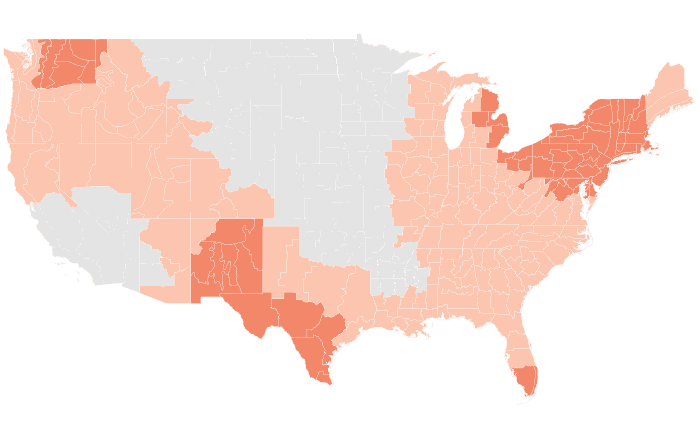
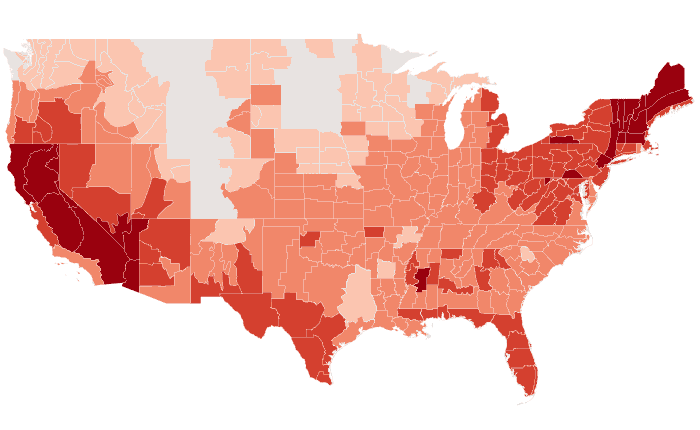
Outlooks
Probability of the favored tercile: 40, 50, 60, 70%+
Observed
Departure from normal: steps at ±0.5, 1, 2, 3°F
Precipitation


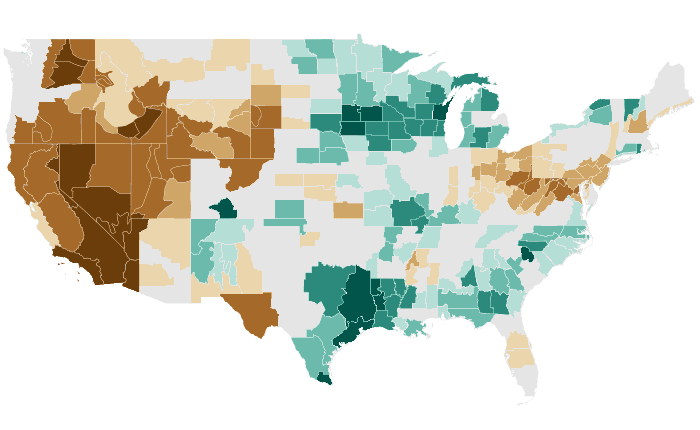
Outlooks
Probability of the favored tercile: 40, 50, 60, 70%+
Observed
Percent of normal: steps at 50, 70, 80, 90, 110, 120, 130, 150%
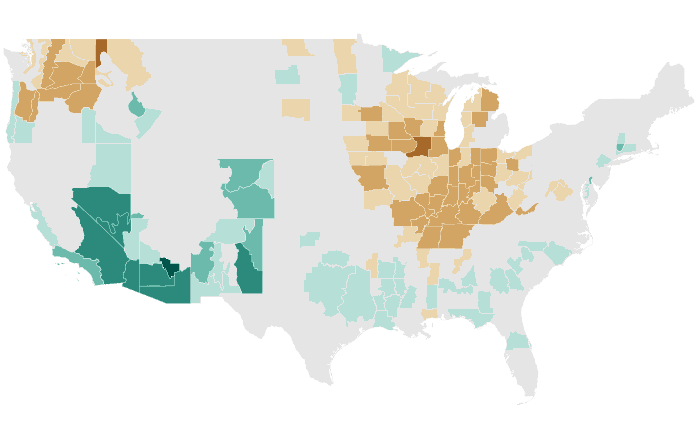
AMJ 2024 issued March 2024
Temperature: 79% accurate, opposite extreme 2% (NOAA CPC 82%, 4%)
Precipitation: 40% accurate, opposite extreme 21% (NOAA CPC 30%, 27%)
Temperature

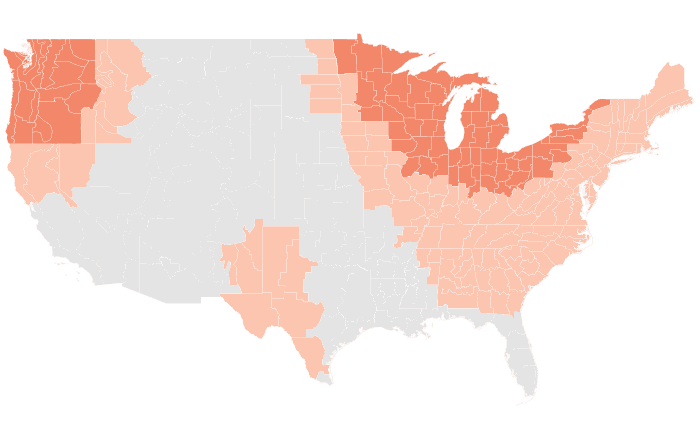
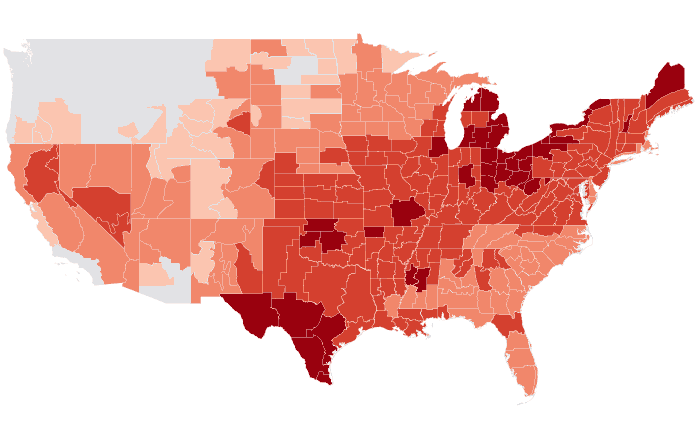
Outlooks
Probability of the favored tercile: 40, 50, 60, 70%+
Observed
Departure from normal: steps at ±0.5, 1, 2, 3°F
Precipitation

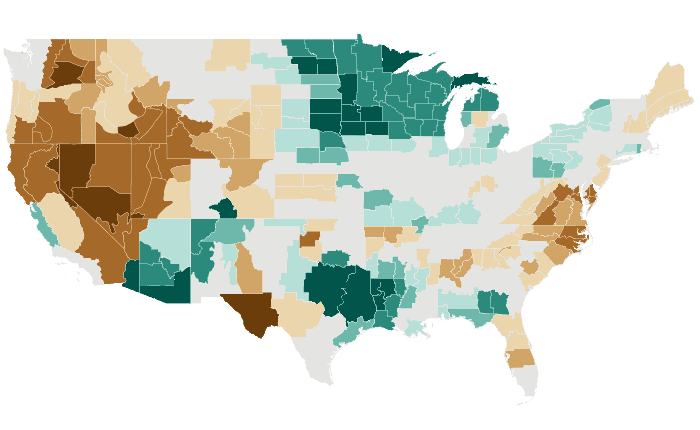
Outlooks
Probability of the favored tercile: 40, 50, 60, 70%+
Observed
Percent of normal: steps at 50, 70, 80, 90, 110, 120, 130, 150%
MAM 2024 issued February 2024
Temperature: 64% accurate, opposite extreme 8% (NOAA CPC 48%, 17%)
Precipitation: 60% accurate, opposite extreme 12% (NOAA CPC 64%, 7%)
Temperature

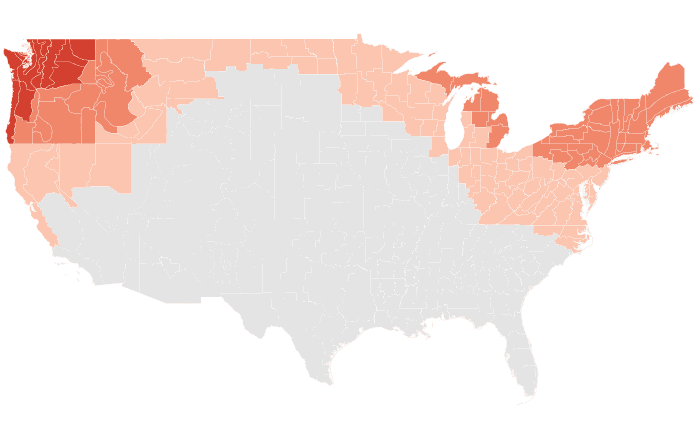

Outlooks
Probability of the favored tercile: 40, 50, 60, 70%+
Observed
Departure from normal: steps at ±0.5, 1, 2, 3°F
Precipitation


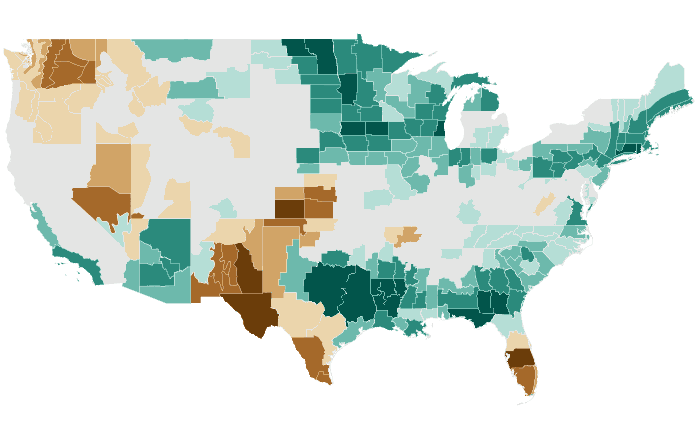
Outlooks
Probability of the favored tercile: 40, 50, 60, 70%+
Observed
Percent of normal: steps at 50, 70, 80, 90, 110, 120, 130, 150%
FMA 2024 issued January 2024
Temperature: 69% accurate, opposite extreme 6% (NOAA CPC 49%, 4%)
Precipitation: 55% accurate, opposite extreme 13% (NOAA CPC 37%, 14%)
Temperature
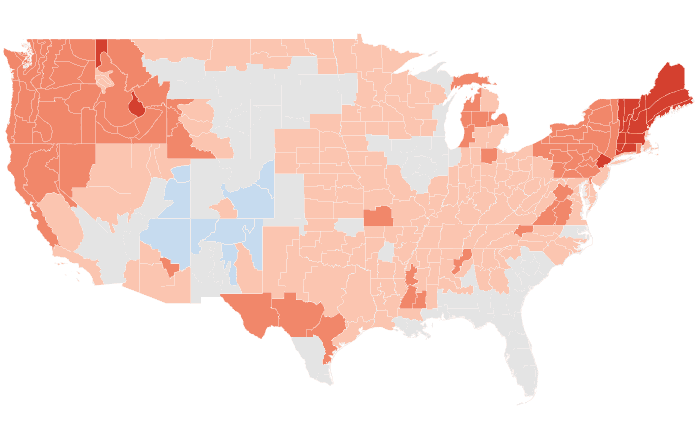

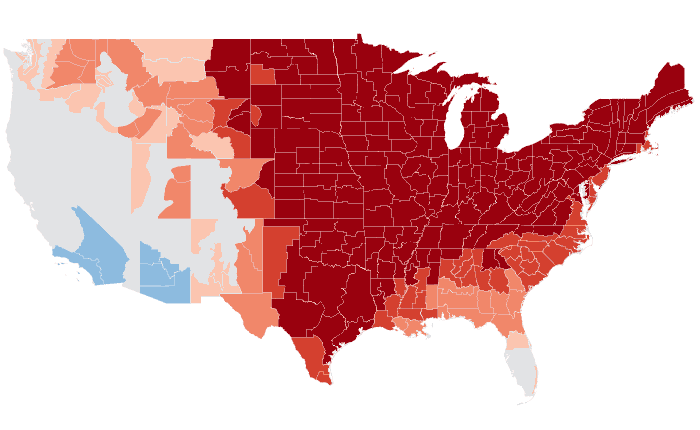
Outlooks
Probability of the favored tercile: 40, 50, 60, 70%+
Observed
Departure from normal: steps at ±0.5, 1, 2, 3°F
Precipitation

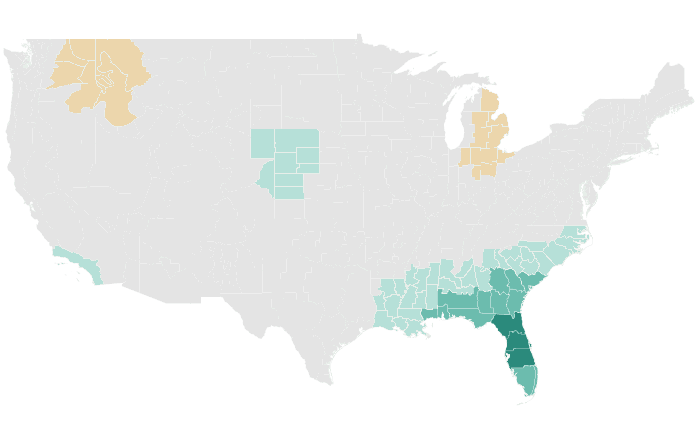
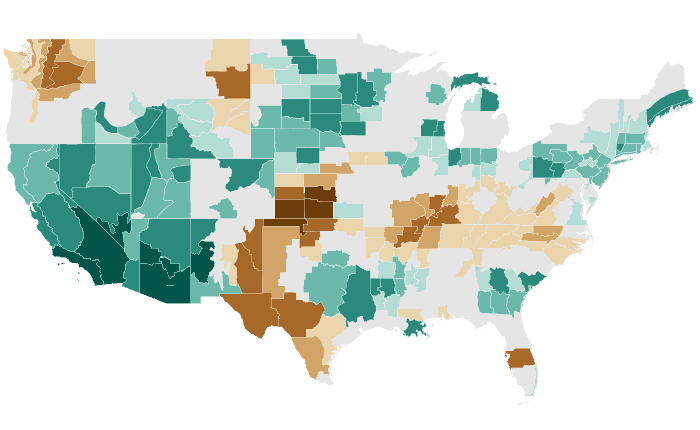
Outlooks
Probability of the favored tercile: 40, 50, 60, 70%+
Observed
Percent of normal: steps at 50, 70, 80, 90, 110, 120, 130, 150%
JFM 2024 issued December 2023
Temperature: 55% accurate, opposite extreme 7% (NOAA CPC 49%, 4%)
Precipitation: 64% accurate, opposite extreme 4% (NOAA CPC 63%, 9%)
Temperature


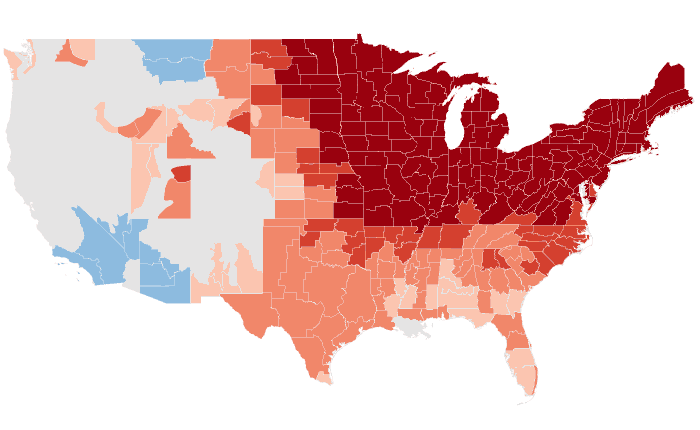
Outlooks
Probability of the favored tercile: 40, 50, 60, 70%+
Observed
Departure from normal: steps at ±0.5, 1, 2, 3°F
Precipitation
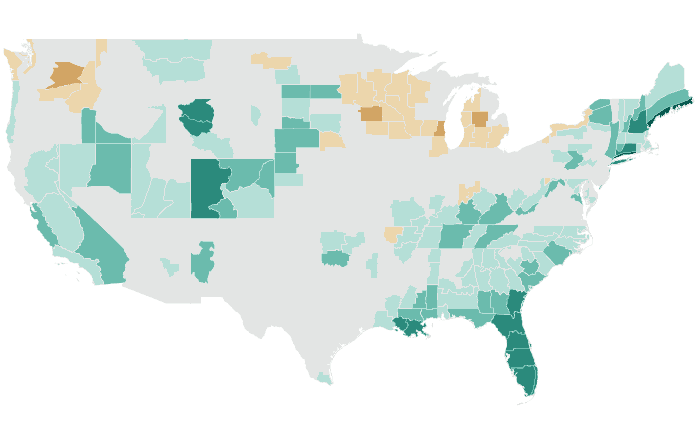
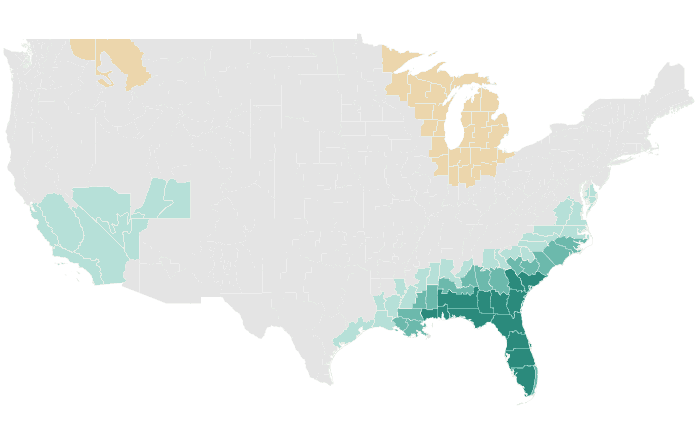

Outlooks
Probability of the favored tercile: 40, 50, 60, 70%+
Observed
Percent of normal: steps at 50, 70, 80, 90, 110, 120, 130, 150%
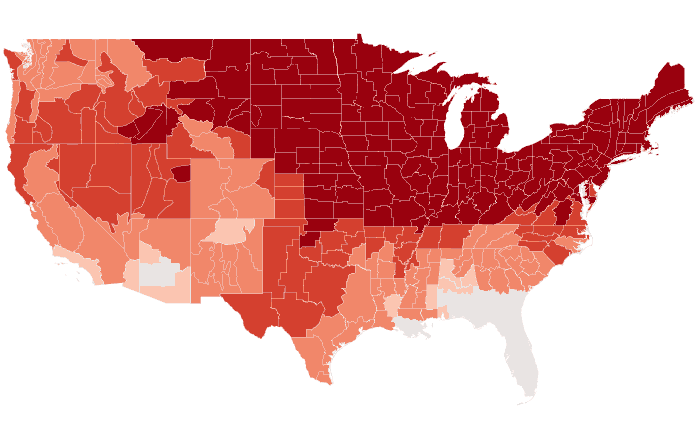
DJF 2023-24 issued November 2023
Temperature: 57% accurate, opposite extreme 7% (NOAA CPC 92%, 0%)
Precipitation: 43% accurate, opposite extreme 14% (NOAA CPC 54%, 1%)
Temperature

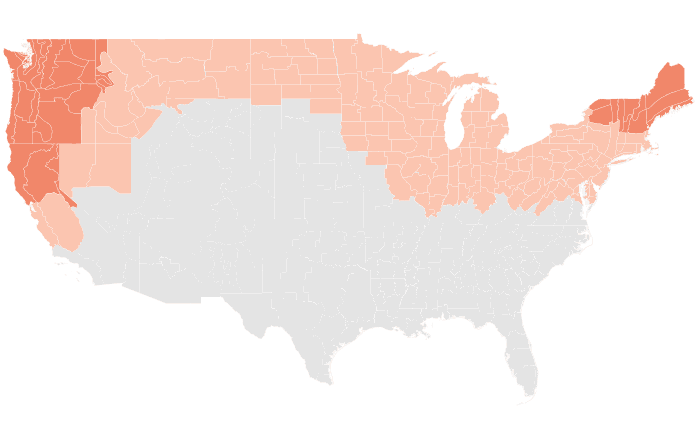
Outlooks
Probability of the favored tercile: 40, 50, 60, 70%+
Observed
Departure from normal: steps at ±0.5, 1, 2, 3°F
Precipitation


Outlooks
Probability of the favored tercile: 40, 50, 60, 70%+
Observed
Percent of normal: steps at 50, 70, 80, 90, 110, 120, 130, 150%
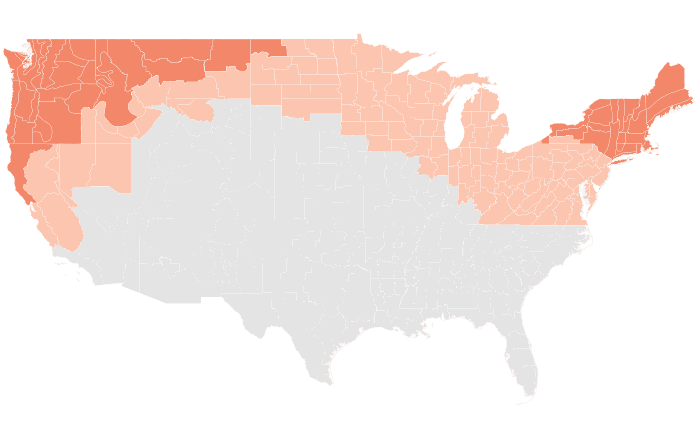
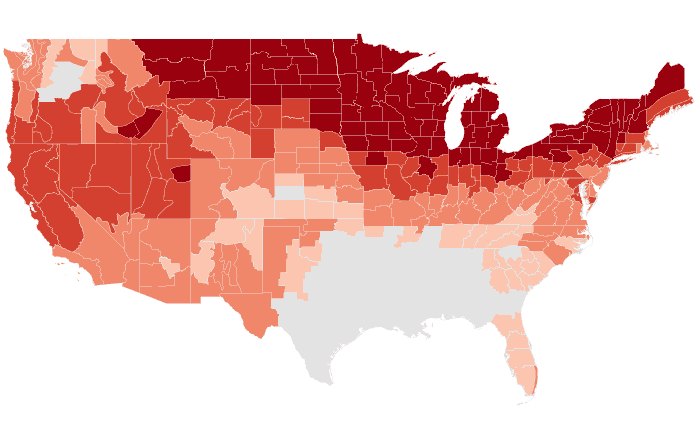
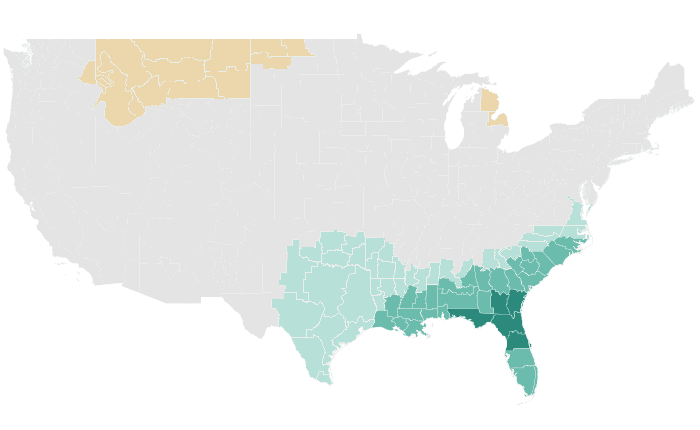
NDJ 2023-24 issued October 2023
Temperature: 75% accurate, opposite extreme 2% (NOAA CPC 92%, 0%)
Precipitation: 42% accurate, opposite extreme 24% (NOAA CPC 59%, 2%)
Temperature

Outlooks
Probability of the favored tercile: 40, 50, 60, 70%+
Observed
Departure from normal: steps at ±0.5, 1, 2, 3°F
Precipitation


Outlooks
Probability of the favored tercile: 40, 50, 60, 70%+
Observed
Percent of normal: steps at 50, 70, 80, 90, 110, 120, 130, 150%
OND 2023 issued September 2023
Temperature: 79% accurate, opposite extreme 0% (NOAA CPC 95%, 0%)
Precipitation: 47% accurate, opposite extreme 22% (NOAA CPC 20%, 32%)
Temperature


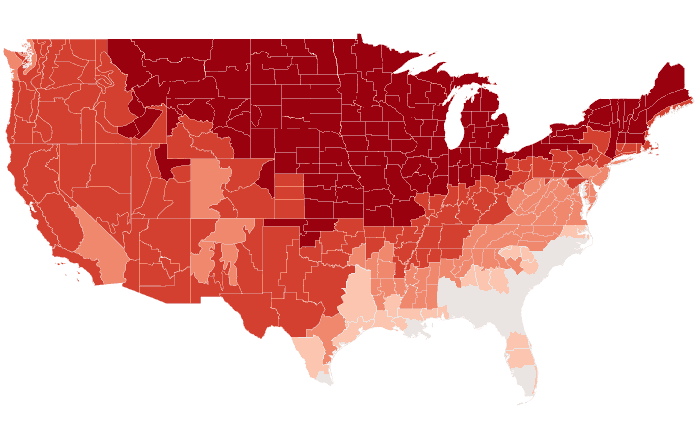
Outlooks
Probability of the favored tercile: 40, 50, 60, 70%+
Observed
Departure from normal: steps at ±0.5, 1, 2, 3°F
Precipitation


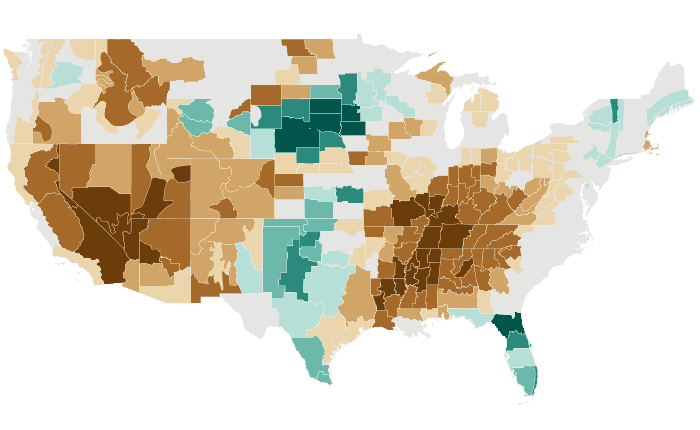
Outlooks
Probability of the favored tercile: 40, 50, 60, 70%+
Observed
Percent of normal: steps at 50, 70, 80, 90, 110, 120, 130, 150%
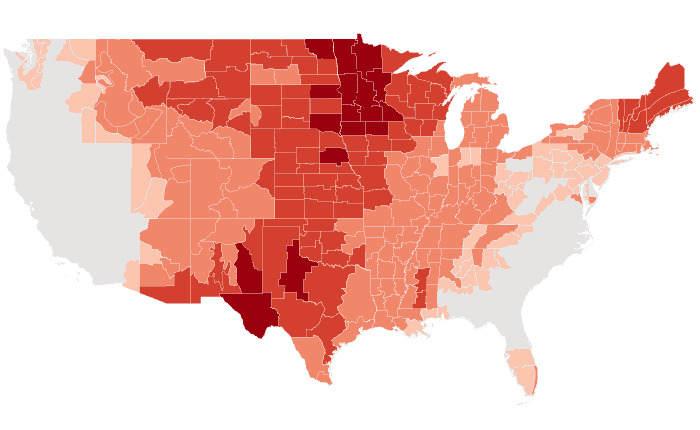
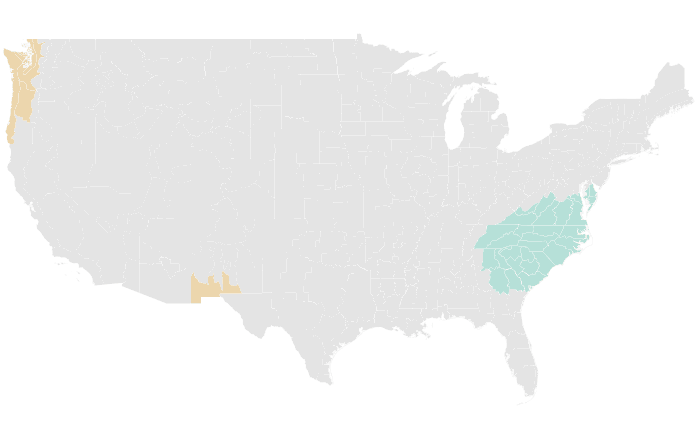
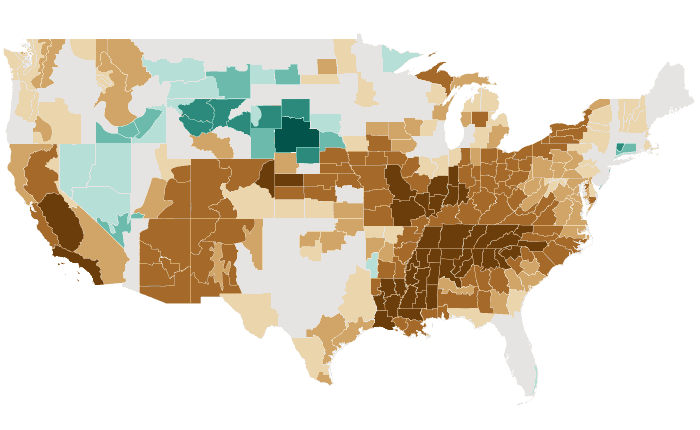
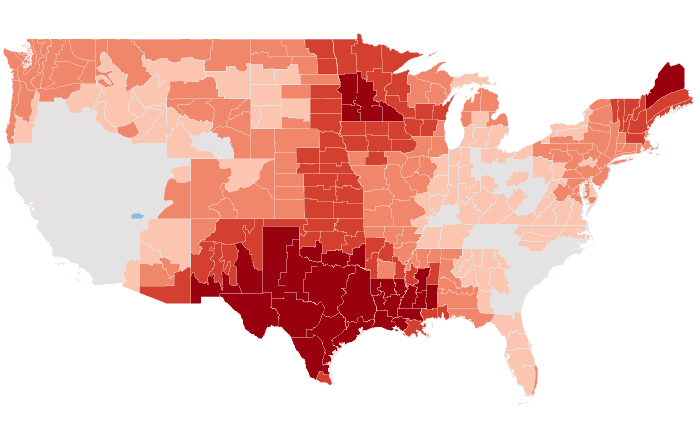
SON 2023 issued August 2023
Temperature: 72% accurate, opposite extreme 0% (NOAA CPC 72%, 0%)
Precipitation: 51% accurate, opposite extreme 21% (NOAA CPC 22%, 74%)
Temperature
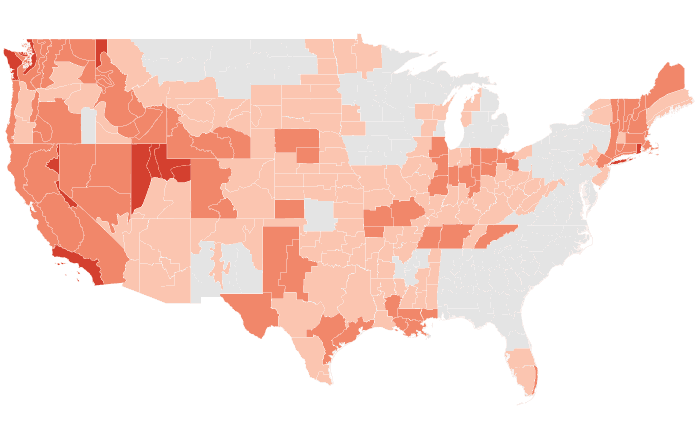
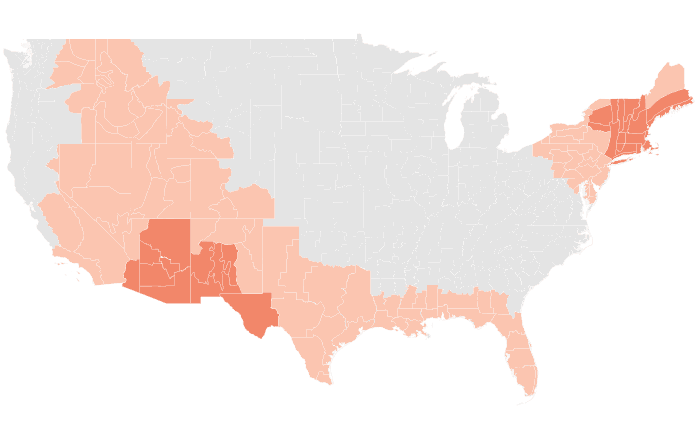
Outlooks
Probability of the favored tercile: 40, 50, 60, 70%+
Observed
Departure from normal: steps at ±0.5, 1, 2, 3°F
Precipitation

Outlooks
Probability of the favored tercile: 40, 50, 60, 70%+
Observed
Percent of normal: steps at 50, 70, 80, 90, 110, 120, 130, 150%
ASO 2023 issued July 2023
Temperature: 78% accurate, opposite extreme 2% (NOAA CPC 73%, 2%)
Precipitation: 50% accurate, opposite extreme 22% (NOAA CPC 27%, 22%)
Temperature


Outlooks
Probability of the favored tercile: 40, 50, 60, 70%+
Observed
Departure from normal: steps at ±0.5, 1, 2, 3°F
Precipitation

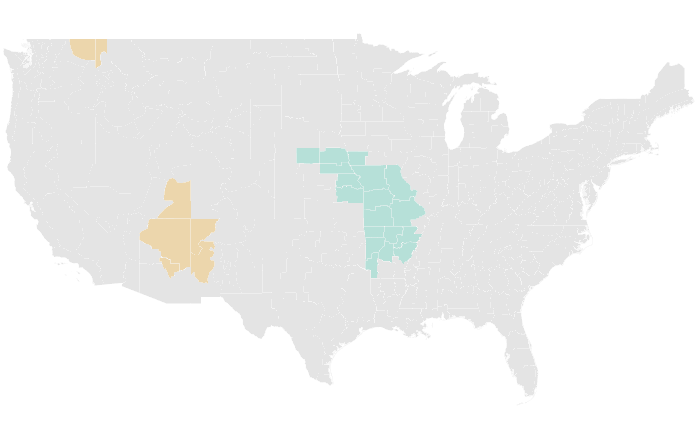
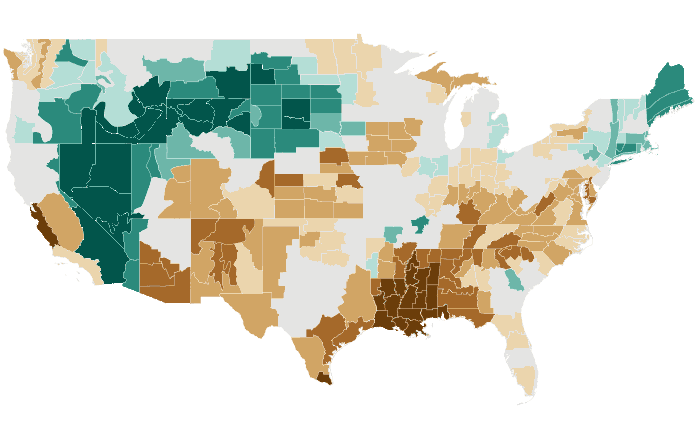
Outlooks
Probability of the favored tercile: 40, 50, 60, 70%+
Observed
Percent of normal: steps at 50, 70, 80, 90, 110, 120, 130, 150%
JAS 2023 issued June 2023
Temperature: 65% accurate, opposite extreme 0% (NOAA CPC 63%, 0%)
Precipitation: 53% accurate, opposite extreme 22% (NOAA CPC 61%, 17%)
Temperature
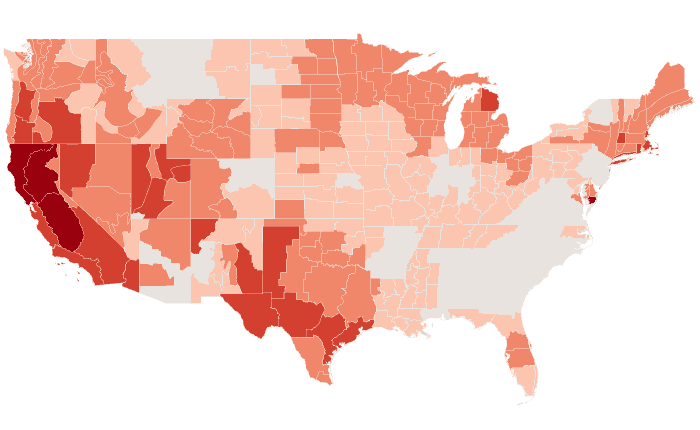

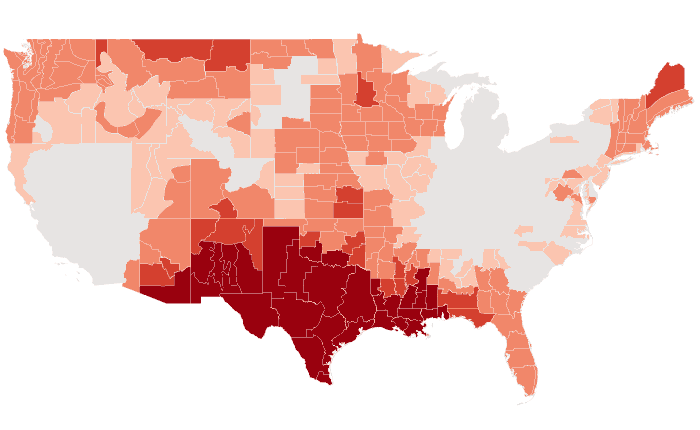
Outlooks
Probability of the favored tercile: 40, 50, 60, 70%+
Observed
Departure from normal: steps at ±0.5, 1, 2, 3°F
Precipitation


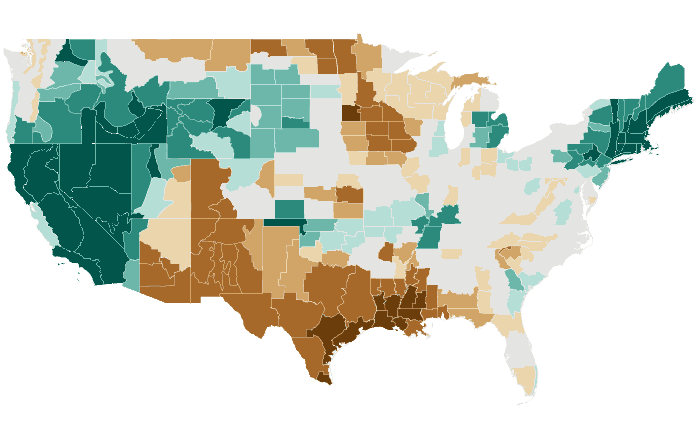
Outlooks
Probability of the favored tercile: 40, 50, 60, 70%+
Observed
Percent of normal: steps at 50, 70, 80, 90, 110, 120, 130, 150%
JJA 2023 issued May 2023
Temperature: 54% accurate, opposite extreme 8% (NOAA CPC 54%, 11%)
Precipitation: 51% accurate, opposite extreme 22% (NOAA CPC 61%, 6%)
Temperature
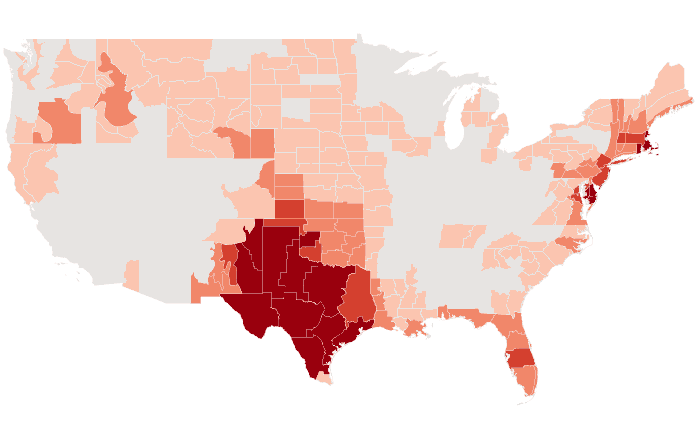


Outlooks
Probability of the favored tercile: 40, 50, 60, 70%+
Observed
Departure from normal: steps at ±0.5, 1, 2, 3°F
Precipitation


Outlooks
Probability of the favored tercile: 40, 50, 60, 70%+
Observed
Percent of normal: steps at 50, 70, 80, 90, 110, 120, 130, 150%
MJJ 2023 issued April 2023
Temperature: 54% accurate, opposite extreme 17% (NOAA CPC 48%, 33%)
Precipitation: 46% accurate, opposite extreme 21% (NOAA CPC 35%, 27%)
Temperature
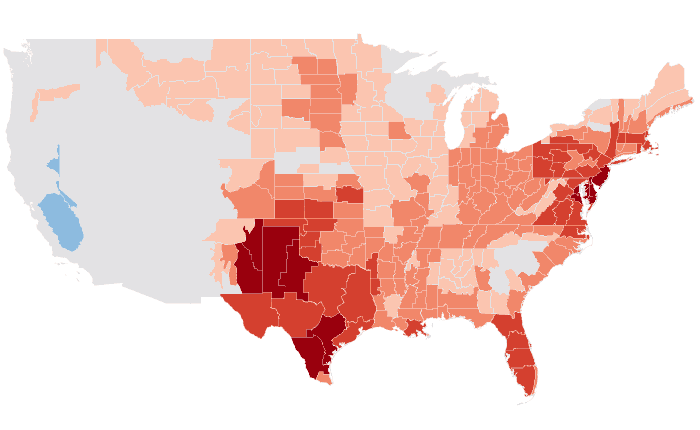

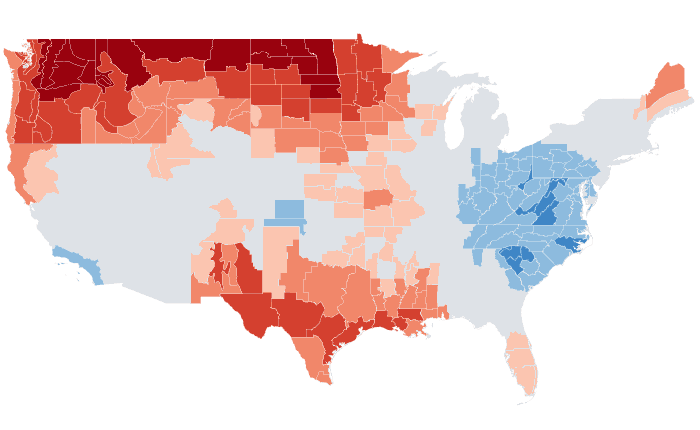
Outlooks
Probability of the favored tercile: 40, 50, 60, 70%+
Observed
Departure from normal: steps at ±0.5, 1, 2, 3°F
Precipitation
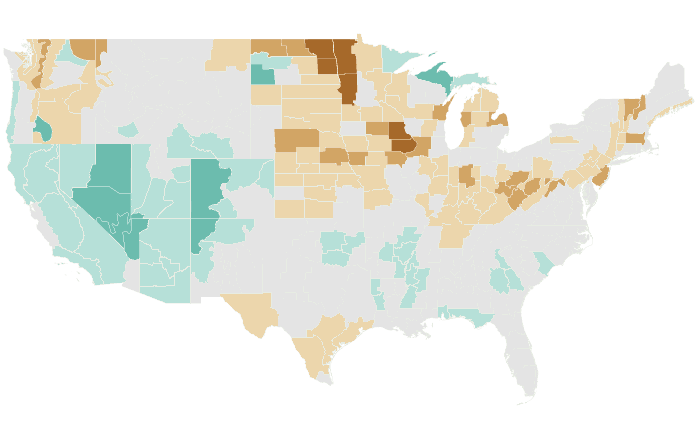
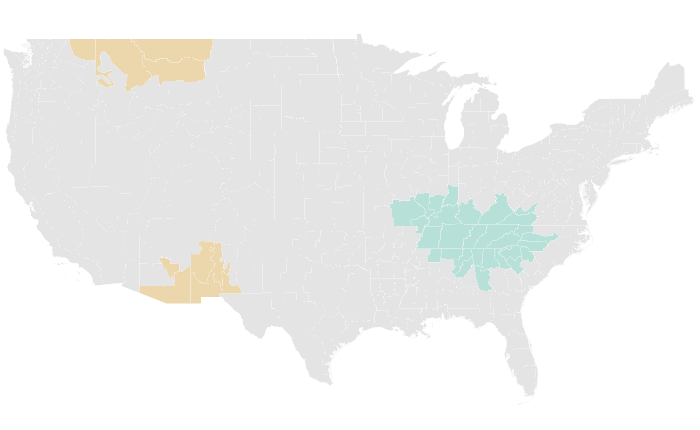
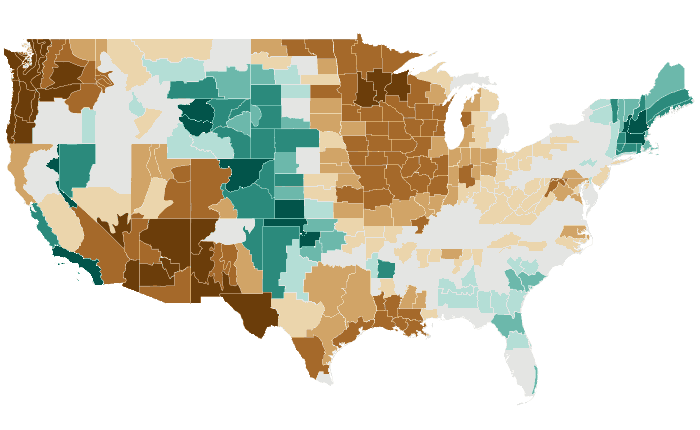
Outlooks
Probability of the favored tercile: 40, 50, 60, 70%+
Observed
Percent of normal: steps at 50, 70, 80, 90, 110, 120, 130, 150%
AMJ 2023 issued March 2023
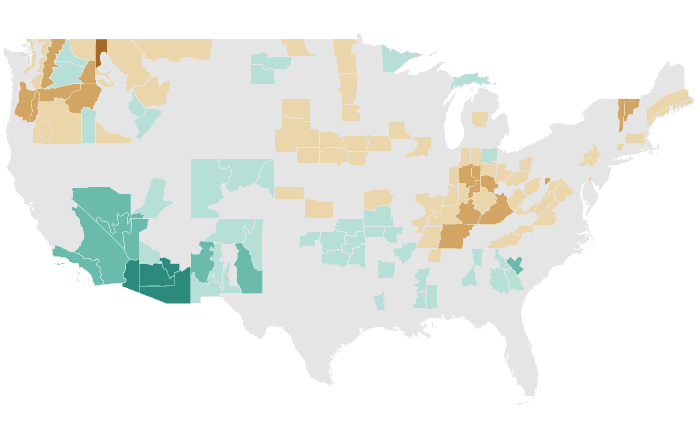
Temperature: 36% accurate, opposite extreme 23% (NOAA CPC 15%, 40%)
Precipitation: 45% accurate, opposite extreme 14% (NOAA CPC 21%, 57%)
Temperature
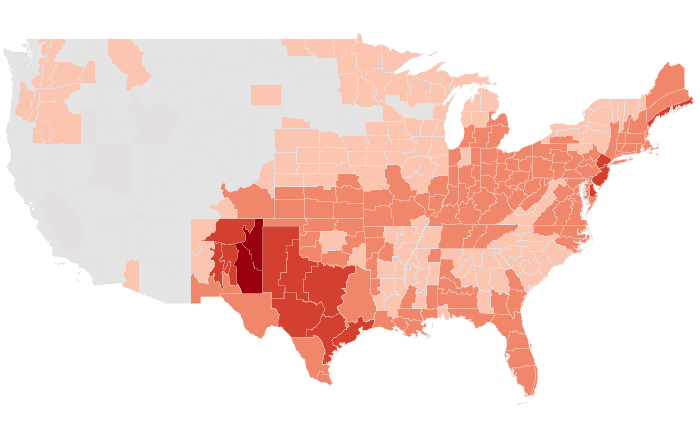


Outlooks
Probability of the favored tercile: 40, 50, 60, 70%+
Observed
Departure from normal: steps at ±0.5, 1, 2, 3°F
Precipitation

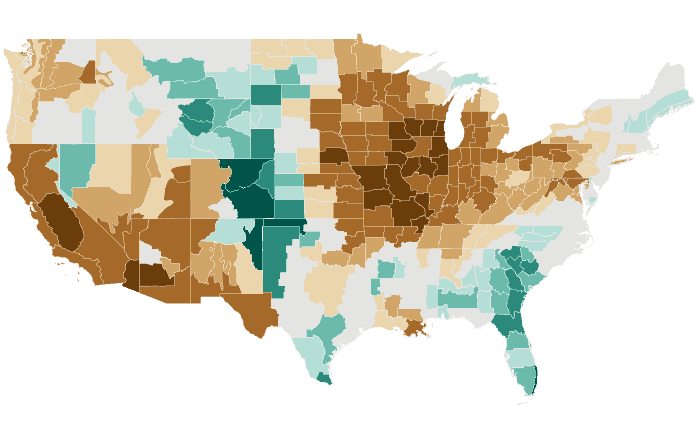
Outlooks
Probability of the favored tercile: 40, 50, 60, 70%+
Observed
Percent of normal: steps at 50, 70, 80, 90, 110, 120, 130, 150%
MAM 2023 issued February 2023
Temperature: 44% accurate, opposite extreme 3% (NOAA CPC 32%, 13%)
Precipitation: 52% accurate, opposite extreme 9% (NOAA CPC 2%, 55%)
Temperature

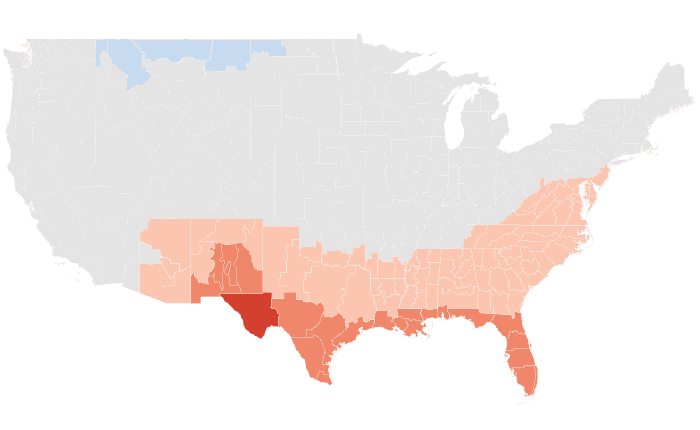

Outlooks
Probability of the favored tercile: 40, 50, 60, 70%+
Observed
Departure from normal: steps at ±0.5, 1, 2, 3°F
Precipitation
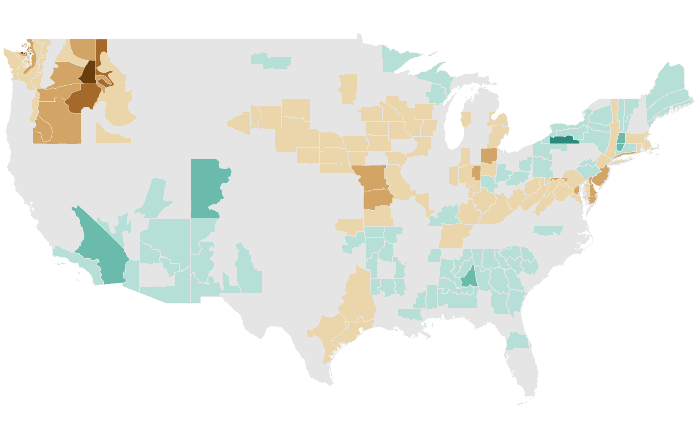

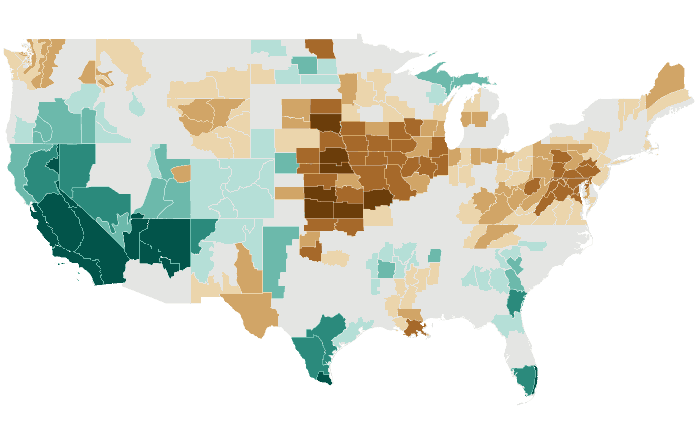
Outlooks
Probability of the favored tercile: 40, 50, 60, 70%+
Observed
Percent of normal: steps at 50, 70, 80, 90, 110, 120, 130, 150%
FMA 2023 issued January 2023
Temperature: 68% accurate, opposite extreme 15% (NOAA CPC 75%, 8%)
Precipitation: 58% accurate, opposite extreme 17% (NOAA CPC 45%, 15%)
Temperature


Outlooks
Probability of the favored tercile: 40, 50, 60, 70%+
Observed
Departure from normal: steps at ±0.5, 1, 2, 3°F
Precipitation
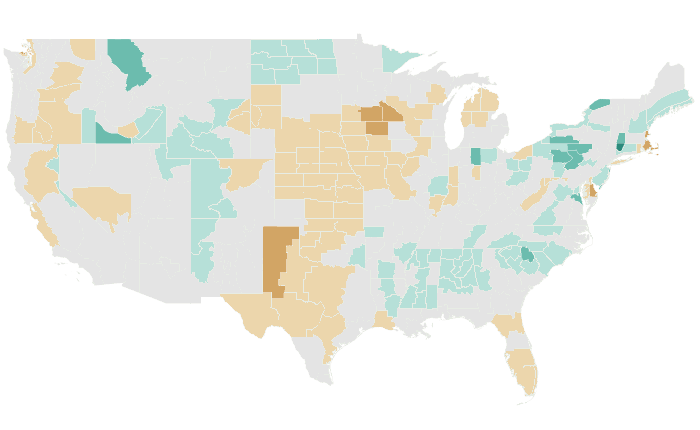
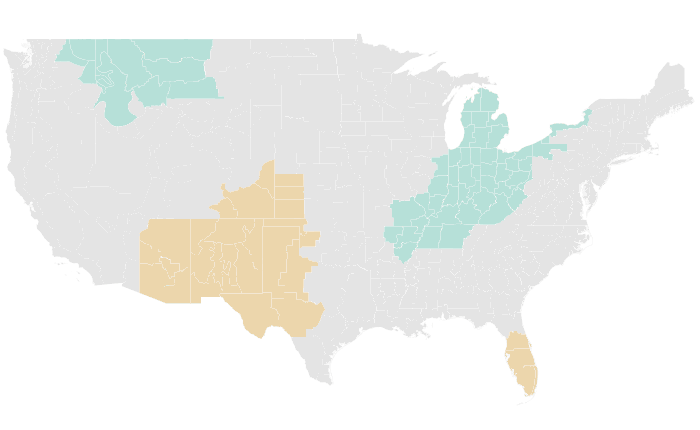
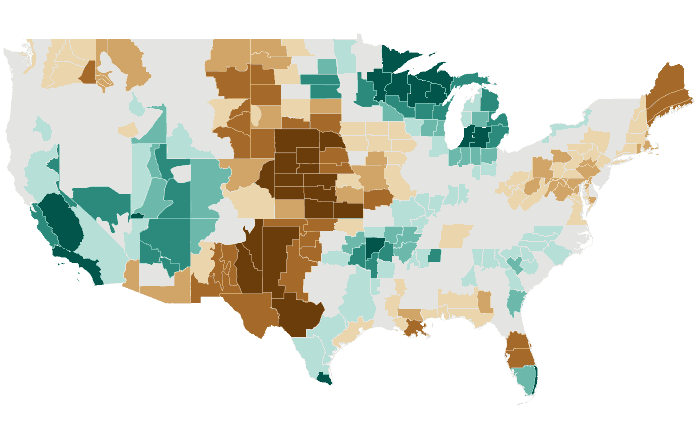
Outlooks
Probability of the favored tercile: 40, 50, 60, 70%+
Observed
Percent of normal: steps at 50, 70, 80, 90, 110, 120, 130, 150%
JFM 2023 issued December 2022
Temperature: 66% accurate, opposite extreme 14% (NOAA CPC 82%, 14%)
Precipitation: 48% accurate, opposite extreme 13% (NOAA CPC 49%, 29%)
Temperature
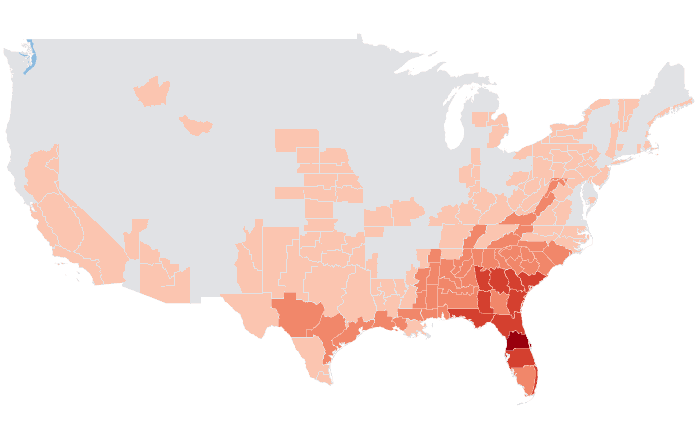


Outlooks
Probability of the favored tercile: 40, 50, 60, 70%+
Observed
Departure from normal: steps at ±0.5, 1, 2, 3°F
Precipitation


Outlooks
Probability of the favored tercile: 40, 50, 60, 70%+
Observed
Percent of normal: steps at 50, 70, 80, 90, 110, 120, 130, 150%
DJF 2022-23 issued November 2022
Temperature: 54% accurate, opposite extreme 22% (NOAA CPC 66%, 10%)
Precipitation: 30% accurate, opposite extreme 29% (NOAA CPC 44%, 21%)
Temperature
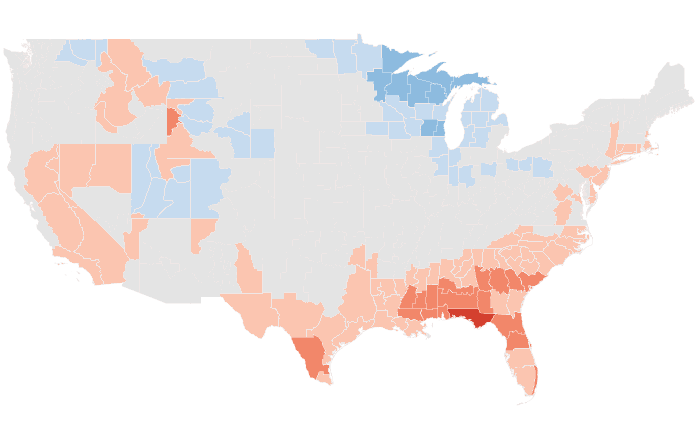


Outlooks
Probability of the favored tercile: 40, 50, 60, 70%+
Observed
Departure from normal: steps at ±0.5, 1, 2, 3°F
Precipitation
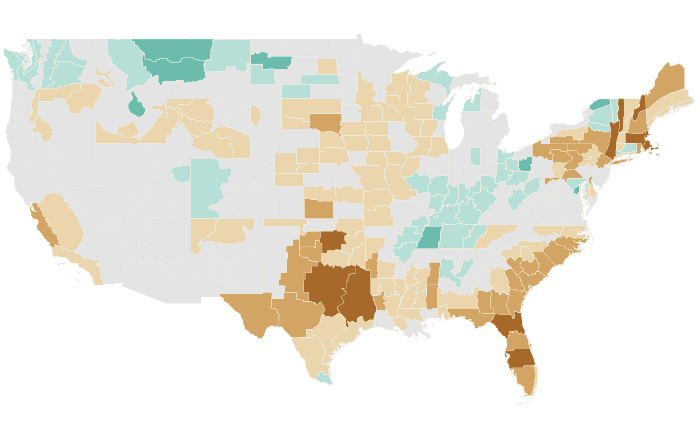


Outlooks
Probability of the favored tercile: 40, 50, 60, 70%+
Observed
Percent of normal: steps at 50, 70, 80, 90, 110, 120, 130, 150%
NDJ 2022-23 issued October 2022
Temperature: 20% accurate, opposite extreme 54% (NOAA CPC 38%, 50%)
Precipitation: 30% accurate, opposite extreme 31% (NOAA CPC 19%, 30%)
Temperature
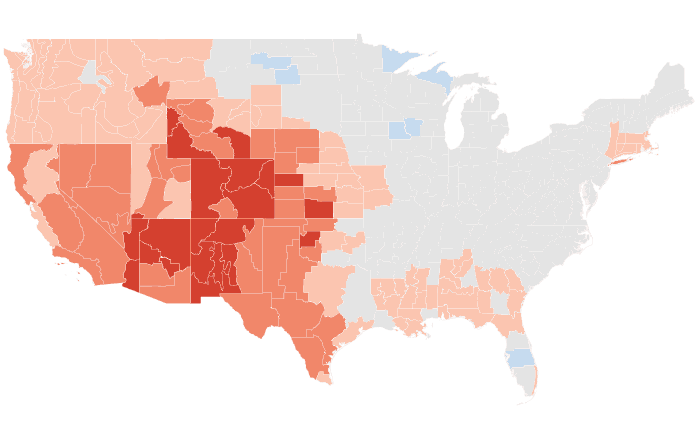
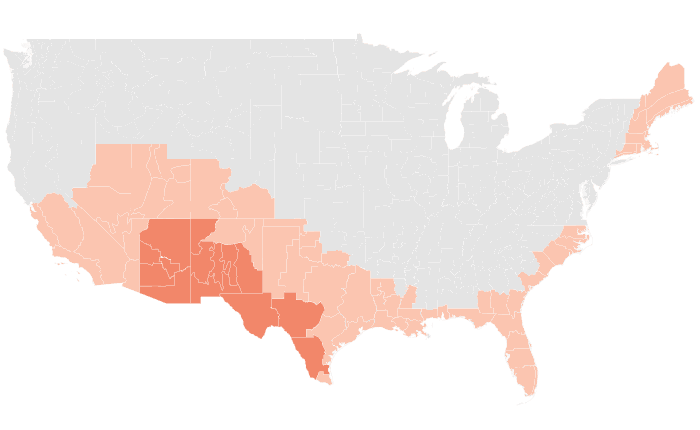
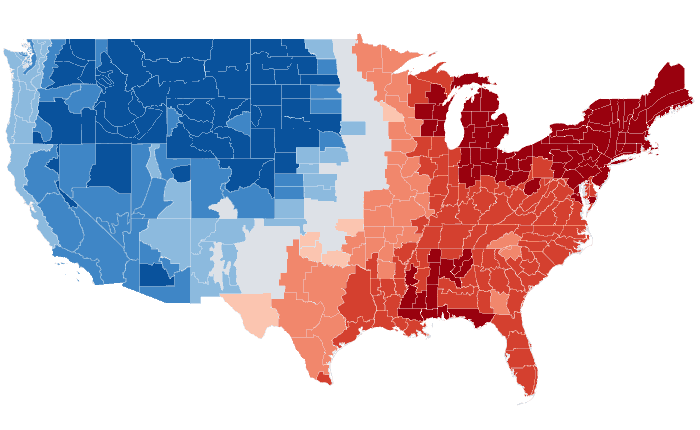
Outlooks
Probability of the favored tercile: 40, 50, 60, 70%+
Observed
Departure from normal: steps at ±0.5, 1, 2, 3°F
Precipitation

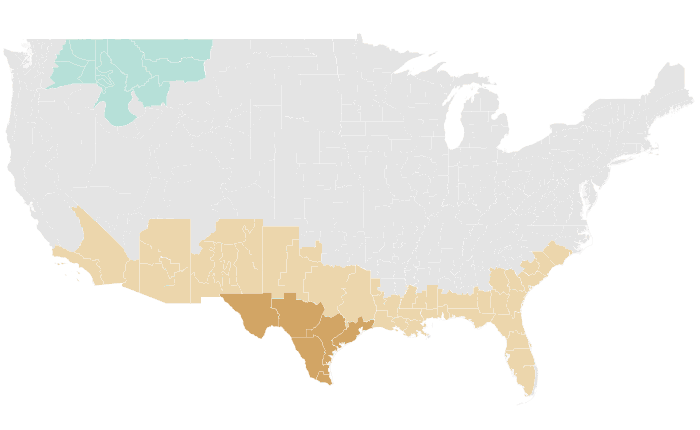

Outlooks
Probability of the favored tercile: 40, 50, 60, 70%+
Observed
Percent of normal: steps at 50, 70, 80, 90, 110, 120, 130, 150%
OND 2022 issued September 2022
Temperature: 9% accurate, opposite extreme 38% (NOAA CPC 8%, 30%)
Precipitation: 35% accurate, opposite extreme 15% (NOAA CPC 15%, 21%)
Temperature
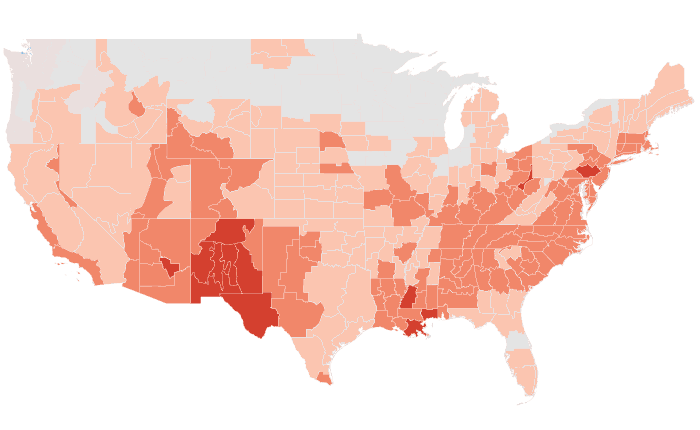

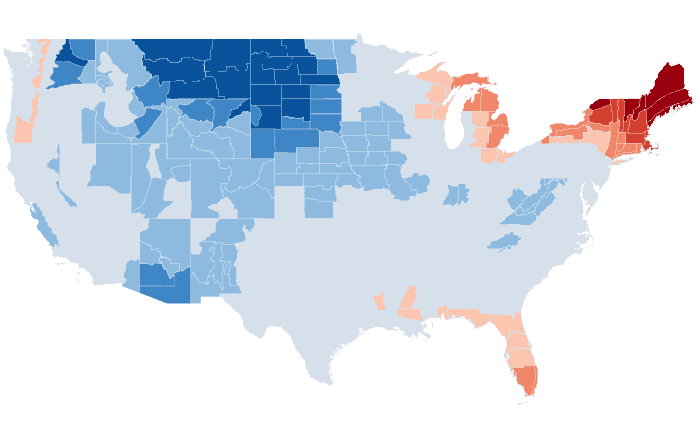
Outlooks
Probability of the favored tercile: 40, 50, 60, 70%+
Observed
Departure from normal: steps at ±0.5, 1, 2, 3°F
Precipitation
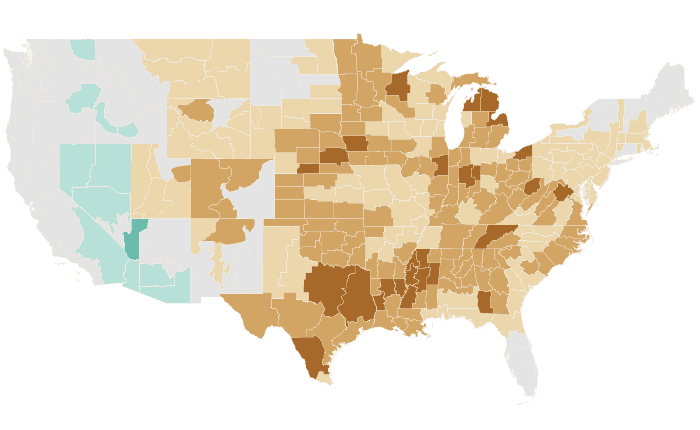

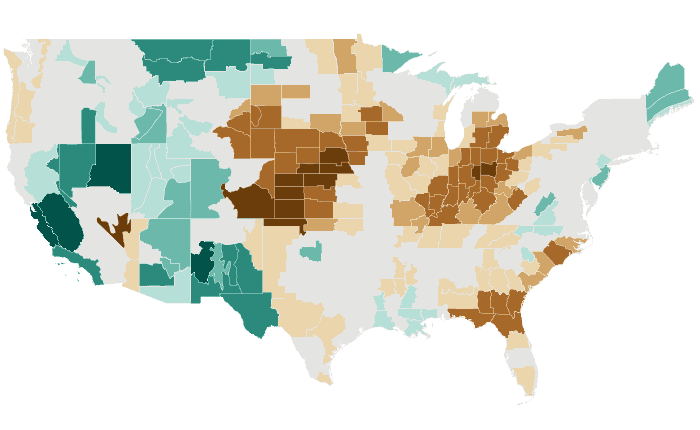
Outlooks
Probability of the favored tercile: 40, 50, 60, 70%+
Observed
Percent of normal: steps at 50, 70, 80, 90, 110, 120, 130, 150%
SON 2022 issued August 2022
Temperature: 27% accurate, opposite extreme 14% (NOAA CPC 19%, 16%)
Precipitation: 51% accurate, opposite extreme 16% (NOAA CPC 54%, 0%)
Temperature

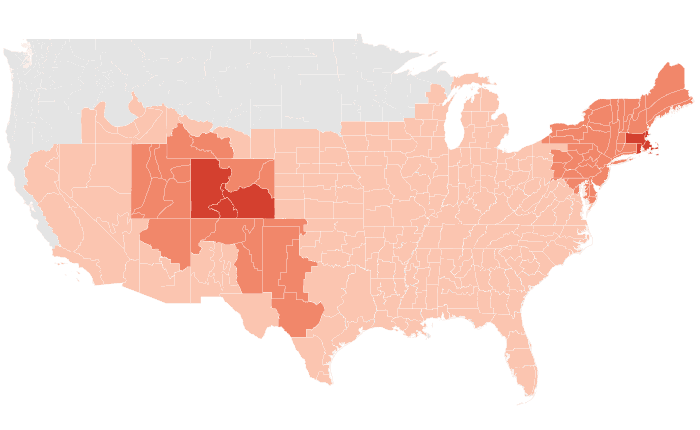

Outlooks
Probability of the favored tercile: 40, 50, 60, 70%+
Observed
Departure from normal: steps at ±0.5, 1, 2, 3°F
Precipitation

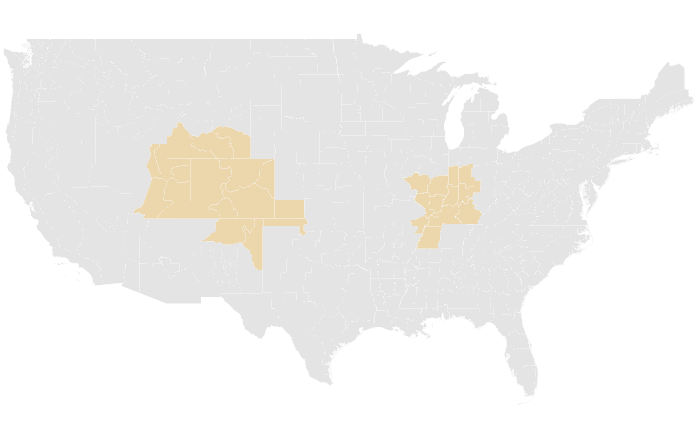
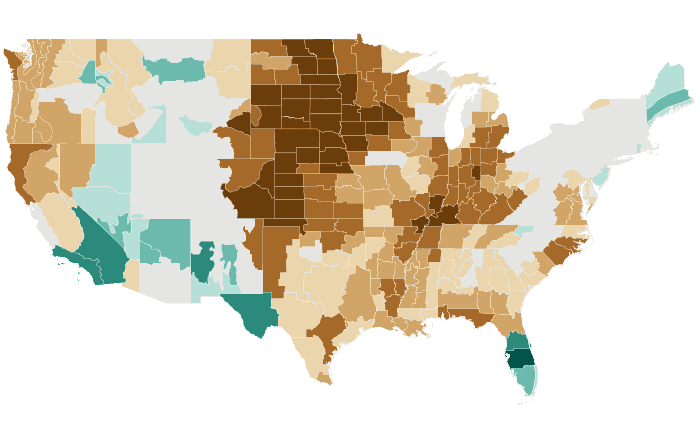
Outlooks
Probability of the favored tercile: 40, 50, 60, 70%+
Observed
Percent of normal: steps at 50, 70, 80, 90, 110, 120, 130, 150%
ASO 2022 issued July 2022
Temperature: 61% accurate, opposite extreme 16% (NOAA CPC 56%, 20%)
Precipitation: 49% accurate, opposite extreme 23% (NOAA CPC 46%, 15%)
Temperature


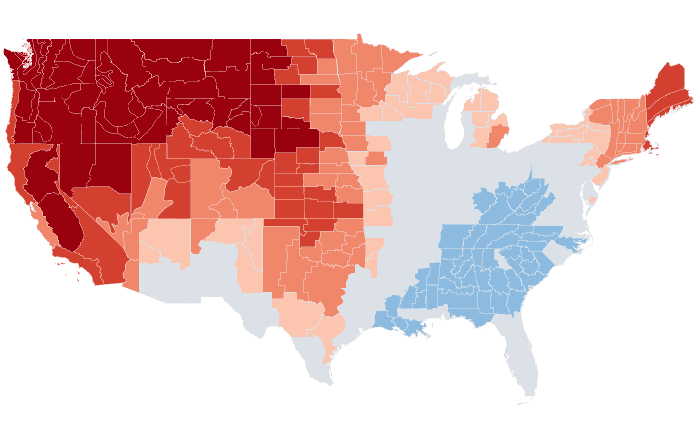
Outlooks
Probability of the favored tercile: 40, 50, 60, 70%+
Observed
Departure from normal: steps at ±0.5, 1, 2, 3°F
Precipitation
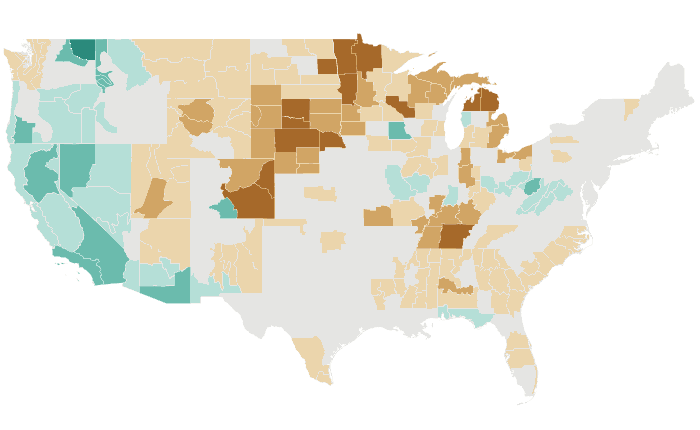


Outlooks
Probability of the favored tercile: 40, 50, 60, 70%+
Observed
Percent of normal: steps at 50, 70, 80, 90, 110, 120, 130, 150%
JAS 2022 issued June 2022
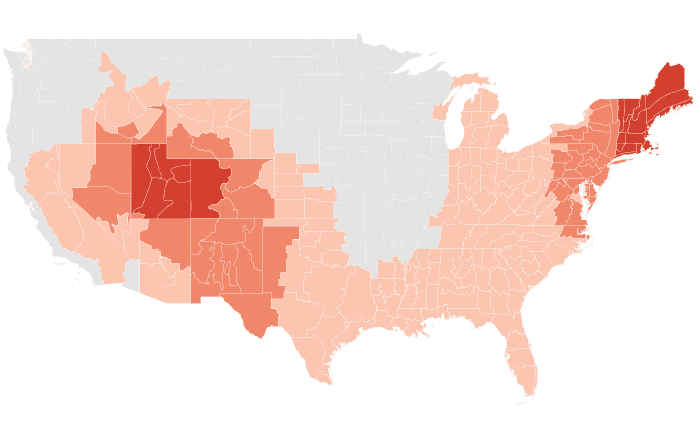
Temperature: 80% accurate, opposite extreme 0% (NOAA CPC 72%, 0%)
Precipitation: 59% accurate, opposite extreme 18% (NOAA CPC 62%, 13%)
Temperature


Outlooks
Probability of the favored tercile: 40, 50, 60, 70%+
Observed
Departure from normal: steps at ±0.5, 1, 2, 3°F
Precipitation


Outlooks
Probability of the favored tercile: 40, 50, 60, 70%+
Observed
Percent of normal: steps at 50, 70, 80, 90, 110, 120, 130, 150%
JJA 2022 issued May 2022
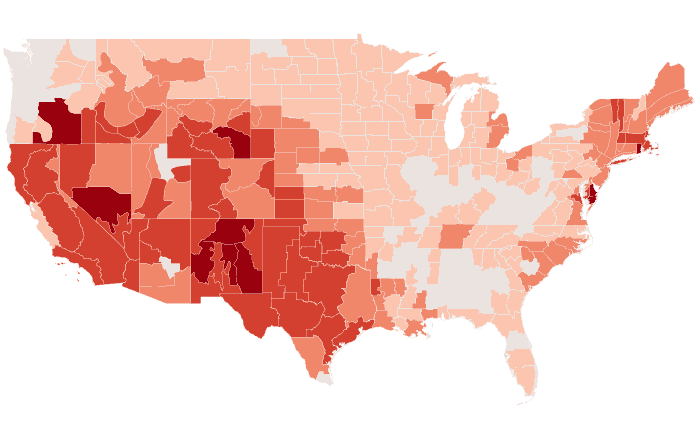
Temperature: 80% accurate, opposite extreme 0% (NOAA CPC 92%, 0%)
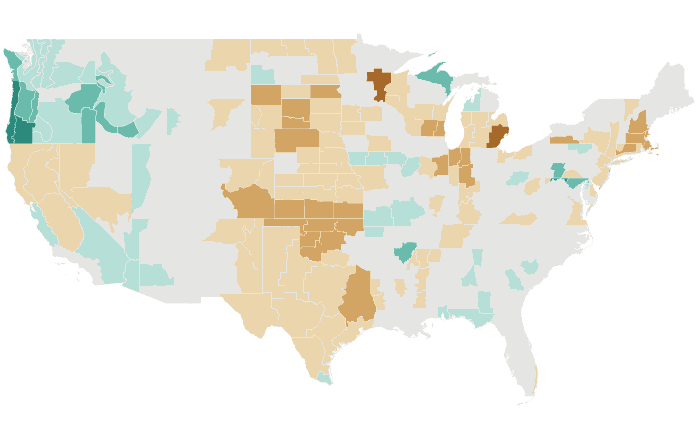
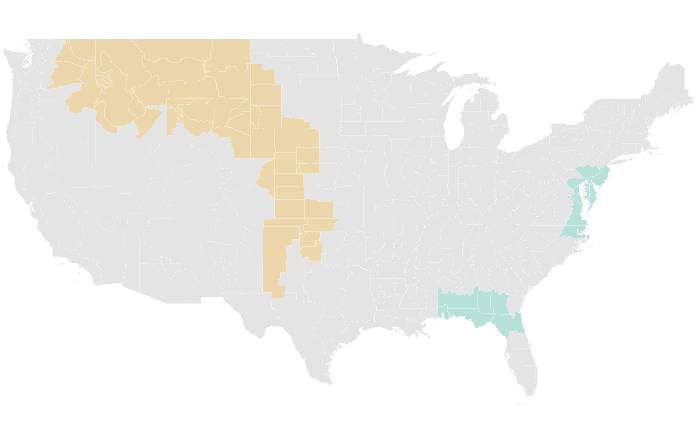
Precipitation: 60% accurate, opposite extreme 16% (NOAA CPC 44%, 19%)
Temperature


Outlooks
Probability of the favored tercile: 40, 50, 60, 70%+
Observed
Departure from normal: steps at ±0.5, 1, 2, 3°F
Precipitation

Outlooks
Probability of the favored tercile: 40, 50, 60, 70%+
Observed
Percent of normal: steps at 50, 70, 80, 90, 110, 120, 130, 150%
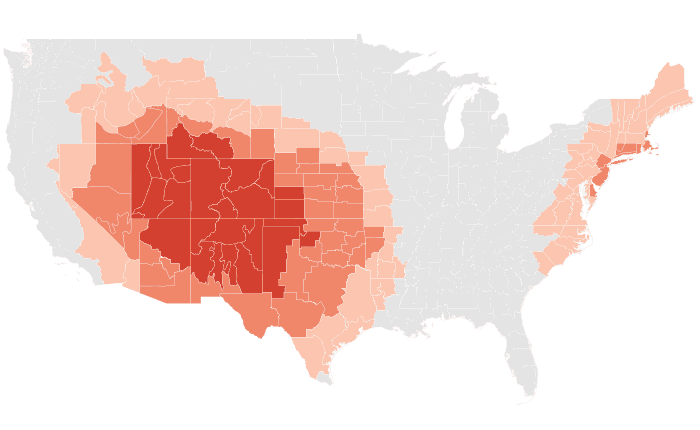
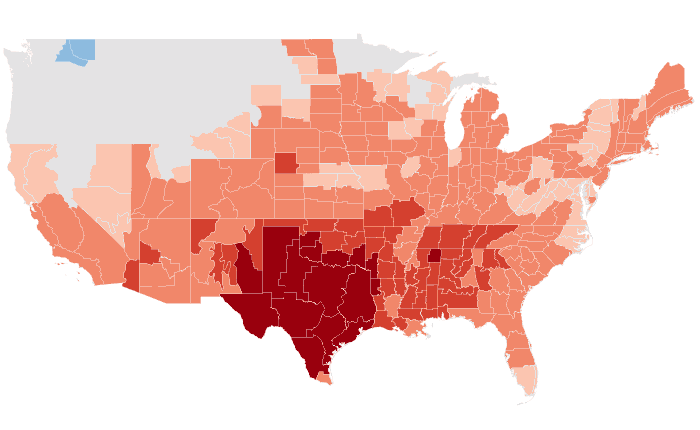
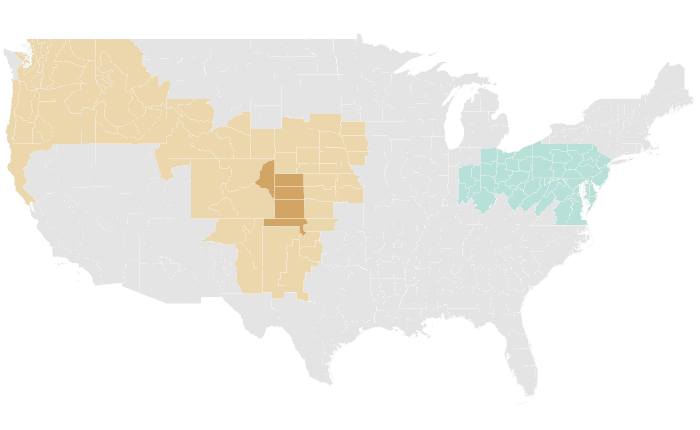
MJJ 2022 issued April 2022
Temperature: 64% accurate, opposite extreme 2% (NOAA CPC 67%, 1%)
Precipitation: 54% accurate, opposite extreme 16% (NOAA CPC 31%, 34%)
Temperature

Outlooks
Probability of the favored tercile: 40, 50, 60, 70%+
Observed
Departure from normal: steps at ±0.5, 1, 2, 3°F
Precipitation


Outlooks
Probability of the favored tercile: 40, 50, 60, 70%+
Observed
Percent of normal: steps at 50, 70, 80, 90, 110, 120, 130, 150%
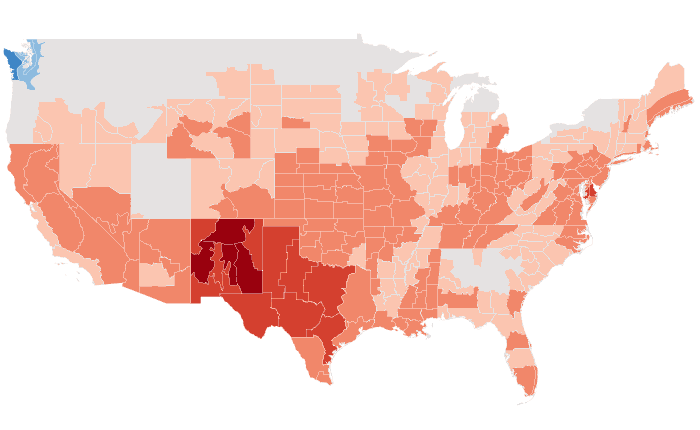
AMJ 2022 issued March 2022
Temperature: 53% accurate, opposite extreme 14% (NOAA CPC 61%, 4%)
Precipitation: 60% accurate, opposite extreme 13% (NOAA CPC 58%, 12%)
Temperature


Outlooks
Probability of the favored tercile: 40, 50, 60, 70%+
Observed
Departure from normal: steps at ±0.5, 1, 2, 3°F
Precipitation
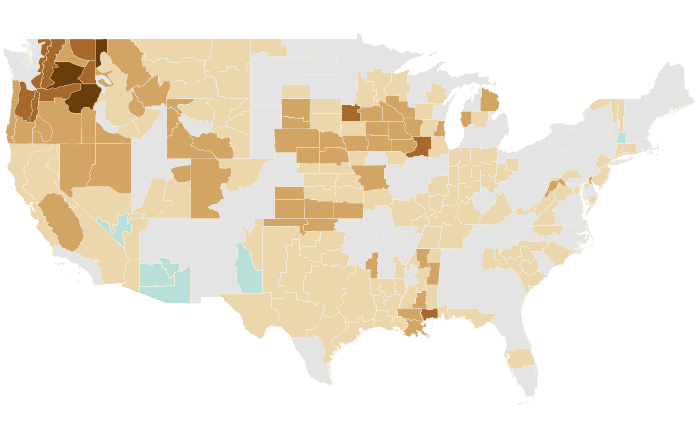
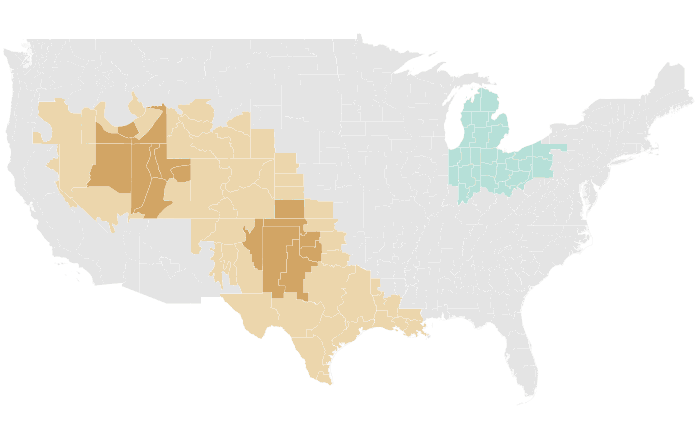

Outlooks
Probability of the favored tercile: 40, 50, 60, 70%+
Observed
Percent of normal: steps at 50, 70, 80, 90, 110, 120, 130, 150%
MAM 2022 issued February 2022
Temperature: 58% accurate, opposite extreme 6% (NOAA CPC 70%, 1%)
Precipitation: 49% accurate, opposite extreme 13% (NOAA CPC 78%, 4%)
Temperature

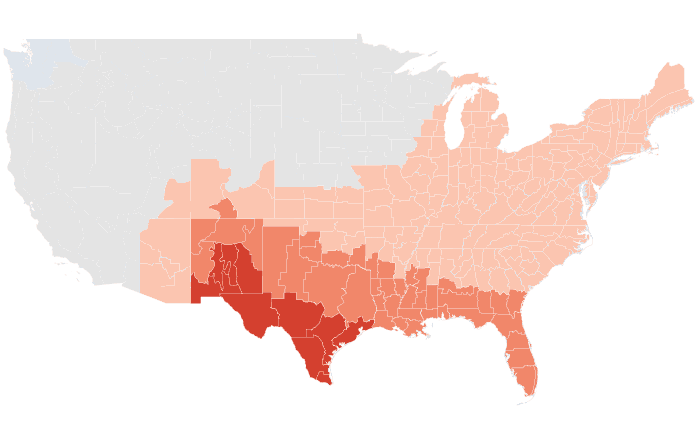
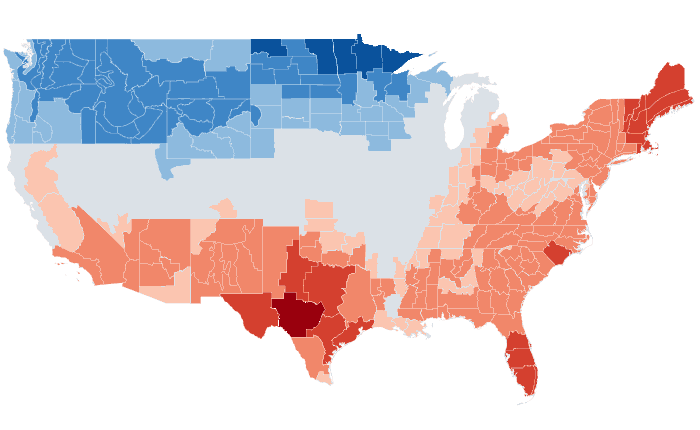
Outlooks
Probability of the favored tercile: 40, 50, 60, 70%+
Observed
Departure from normal: steps at ±0.5, 1, 2, 3°F
Precipitation
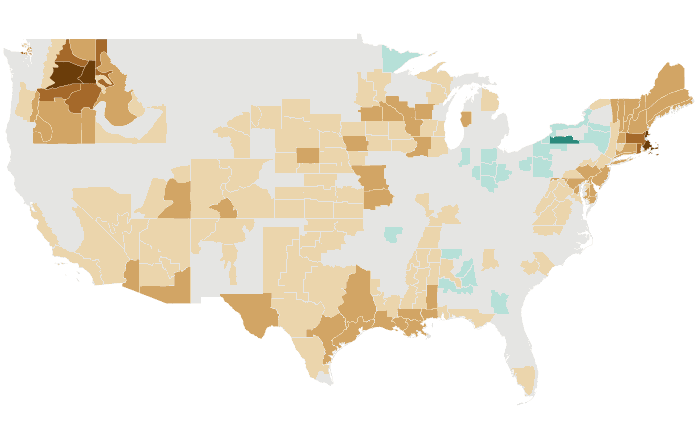


Outlooks
Probability of the favored tercile: 40, 50, 60, 70%+
Observed
Percent of normal: steps at 50, 70, 80, 90, 110, 120, 130, 150%
FMA 2022 issued January 2022
Temperature: 27% accurate, opposite extreme 34% (NOAA CPC 28%, 36%)
Precipitation: 66% accurate, opposite extreme 9% (NOAA CPC 81%, 4%)
Temperature


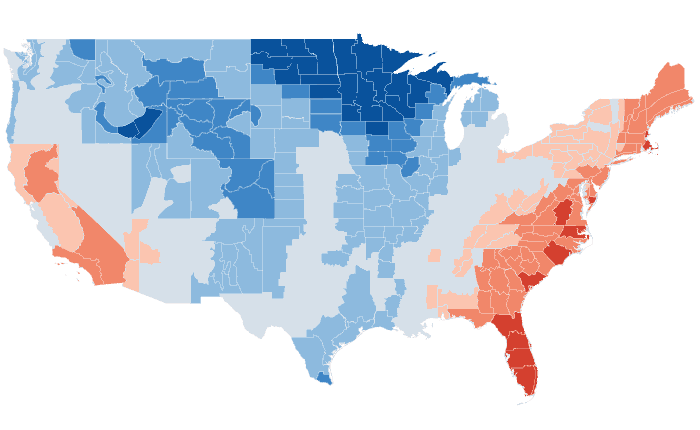
Outlooks
Probability of the favored tercile: 40, 50, 60, 70%+
Observed
Departure from normal: steps at ±0.5, 1, 2, 3°F
Precipitation

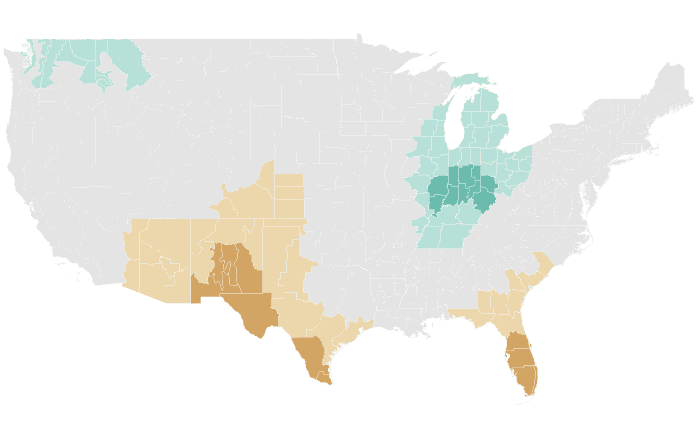
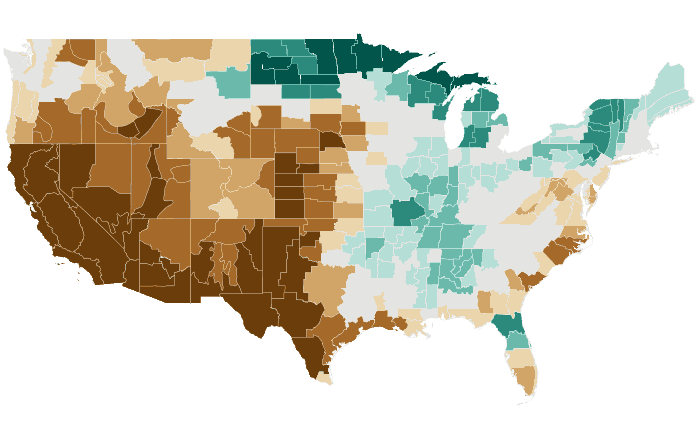
Outlooks
Probability of the favored tercile: 40, 50, 60, 70%+
Observed
Percent of normal: steps at 50, 70, 80, 90, 110, 120, 130, 150%
JFM 2022 issued December 2021
Temperature: 20% accurate, opposite extreme 34% (NOAA CPC 12%, 42%)
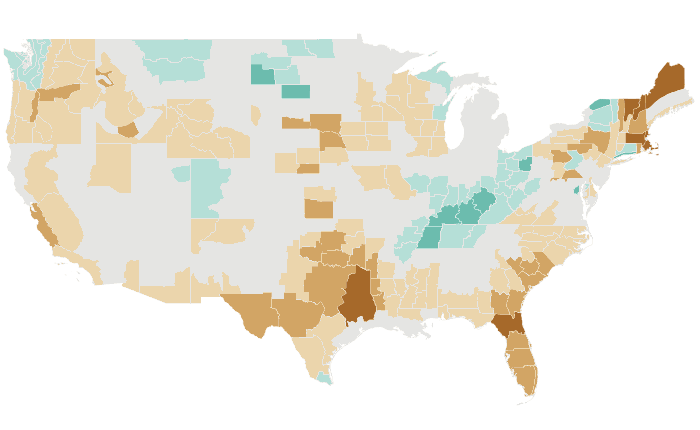
Precipitation: 52% accurate, opposite extreme 10% (NOAA CPC 72%, 6%)
Temperature
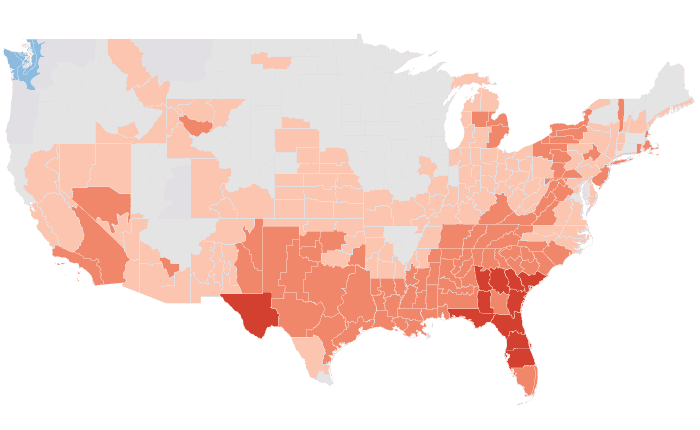

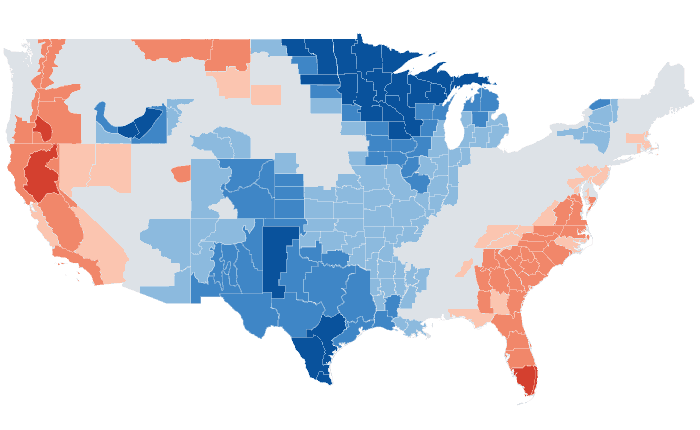
Outlooks
Probability of the favored tercile: 40, 50, 60, 70%+
Observed
Departure from normal: steps at ±0.5, 1, 2, 3°F
Precipitation


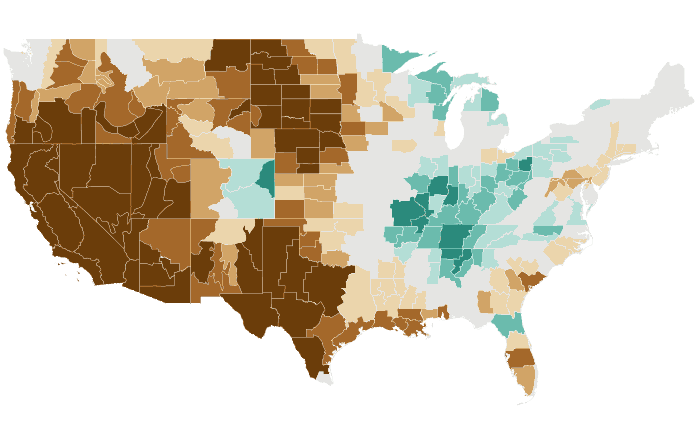
Outlooks
Probability of the favored tercile: 40, 50, 60, 70%+
Observed
Percent of normal: steps at 50, 70, 80, 90, 110, 120, 130, 150%
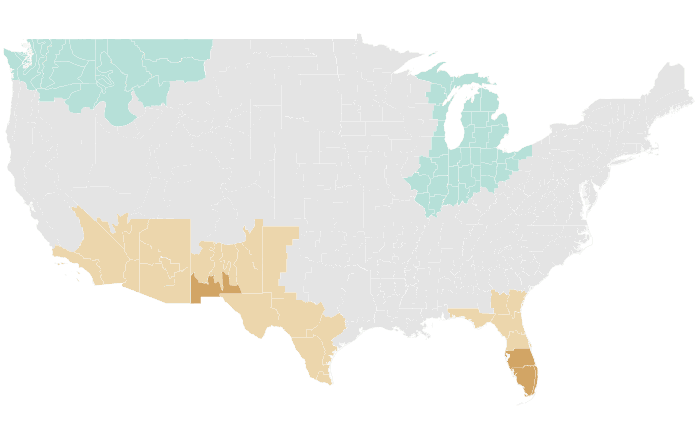
DJF 2021-22 issued November 2021
Temperature: 62% accurate, opposite extreme 3% (NOAA CPC 58%, 0%)
Precipitation: 63% accurate, opposite extreme 2% (NOAA CPC 54%, 12%)
Temperature


Outlooks
Probability of the favored tercile: 40, 50, 60, 70%+
Observed
Departure from normal: steps at ±0.5, 1, 2, 3°F
Precipitation
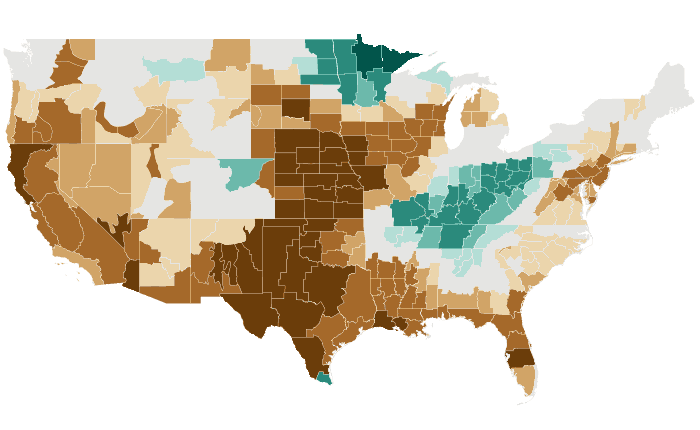
Outlooks
Probability of the favored tercile: 40, 50, 60, 70%+
Observed
Percent of normal: steps at 50, 70, 80, 90, 110, 120, 130, 150%
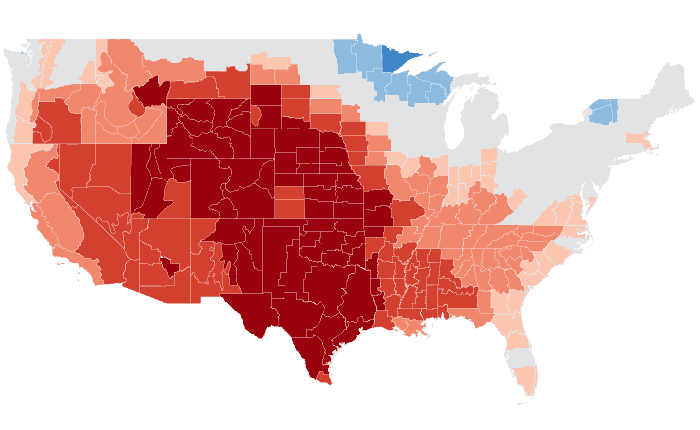
NDJ 2021-22 issued October 2021
Temperature: 65% accurate, opposite extreme 0% (NOAA CPC 71%, 0%)
Precipitation: 58% accurate, opposite extreme 4% (NOAA CPC 58%, 14%)
Temperature

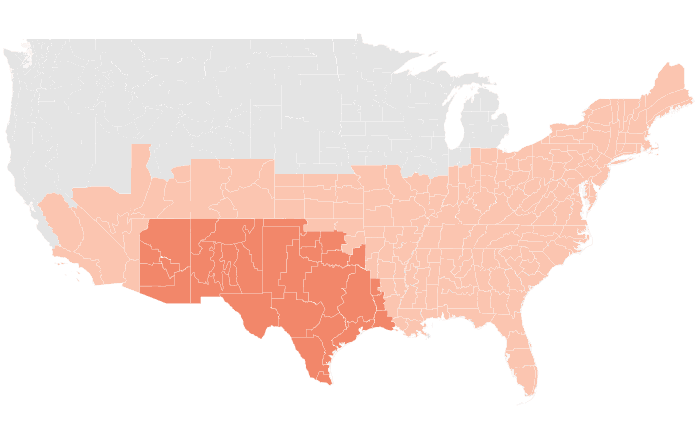
Outlooks
Probability of the favored tercile: 40, 50, 60, 70%+
Observed
Departure from normal: steps at ±0.5, 1, 2, 3°F
Precipitation
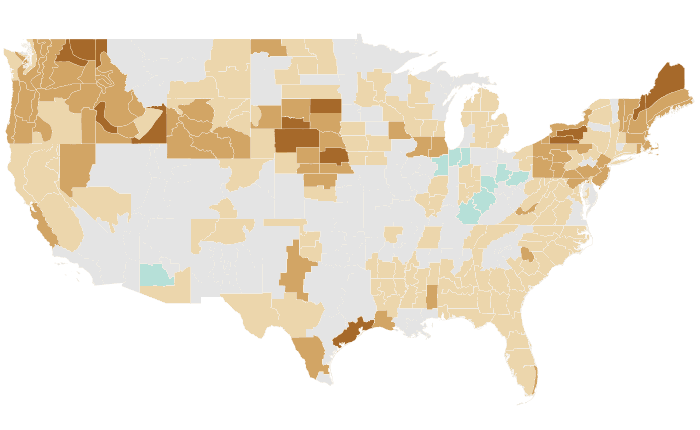
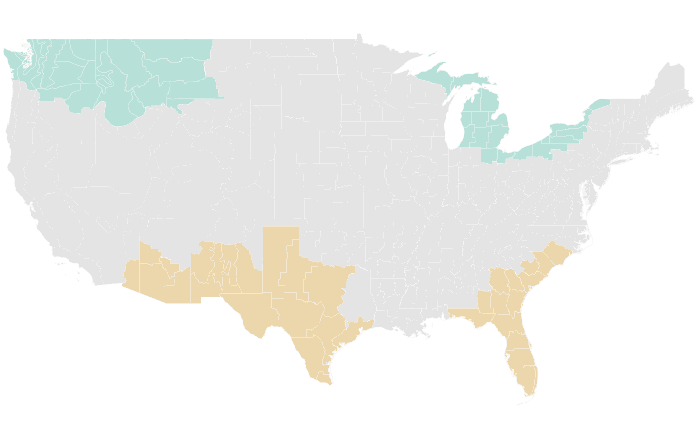

Outlooks
Probability of the favored tercile: 40, 50, 60, 70%+
Observed
Percent of normal: steps at 50, 70, 80, 90, 110, 120, 130, 150%
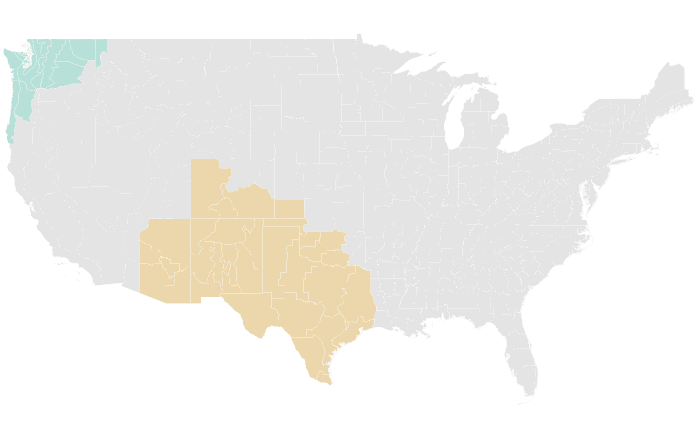
OND 2021 issued September 2021
Temperature: 88% accurate, opposite extreme 2% (NOAA CPC 96%, 0%)
Precipitation: 42% accurate, opposite extreme 18% (NOAA CPC 64%, 6%)
Temperature

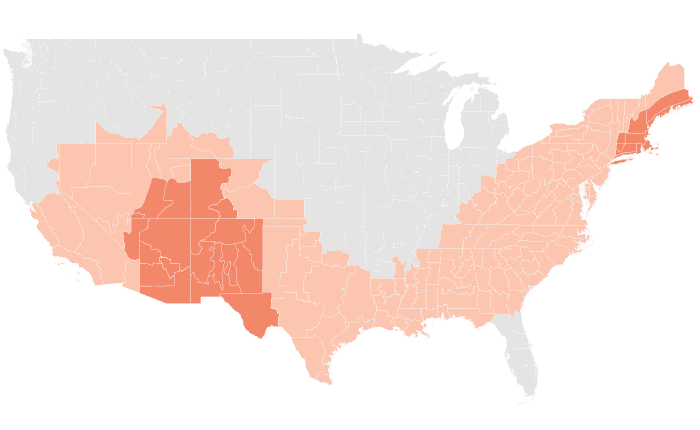

Outlooks
Probability of the favored tercile: 40, 50, 60, 70%+
Observed
Departure from normal: steps at ±0.5, 1, 2, 3°F
Precipitation
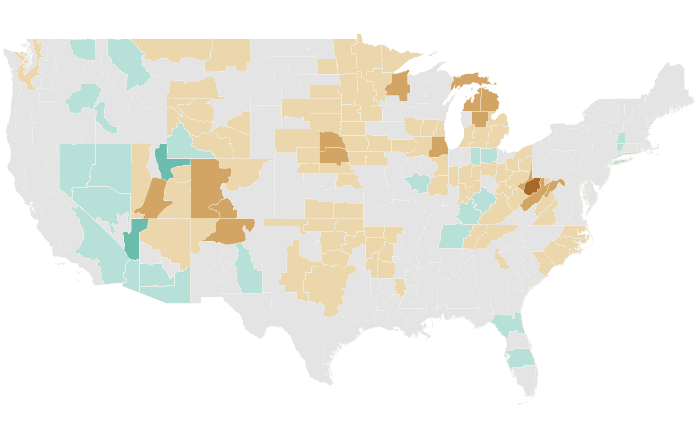

Outlooks
Probability of the favored tercile: 40, 50, 60, 70%+
Observed
Percent of normal: steps at 50, 70, 80, 90, 110, 120, 130, 150%
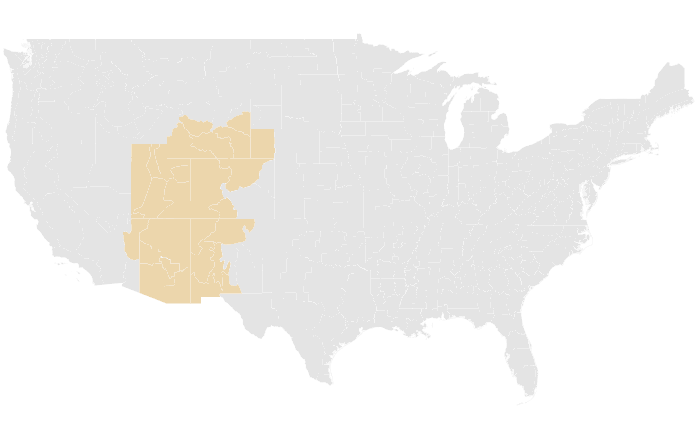
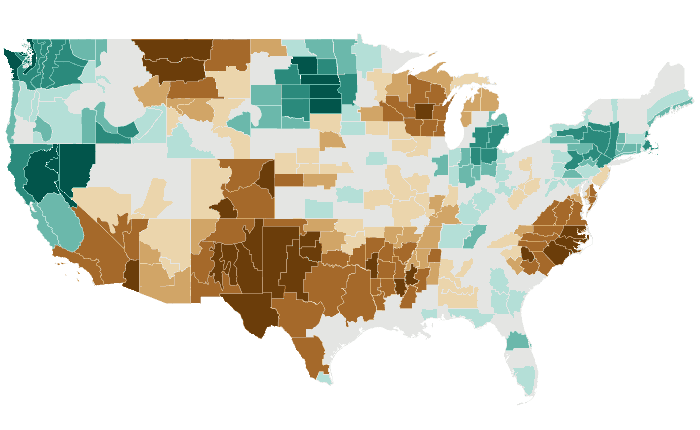
SON 2021 issued August 2021
Temperature: 77% accurate, opposite extreme 0% (NOAA CPC 93%, 0%)
Precipitation: 40% accurate, opposite extreme 24% (NOAA CPC 37%, 2%)
Temperature


Outlooks
Probability of the favored tercile: 40, 50, 60, 70%+
Observed
Departure from normal: steps at ±0.5, 1, 2, 3°F
Precipitation

Outlooks
Probability of the favored tercile: 40, 50, 60, 70%+
Observed
Percent of normal: steps at 50, 70, 80, 90, 110, 120, 130, 150%
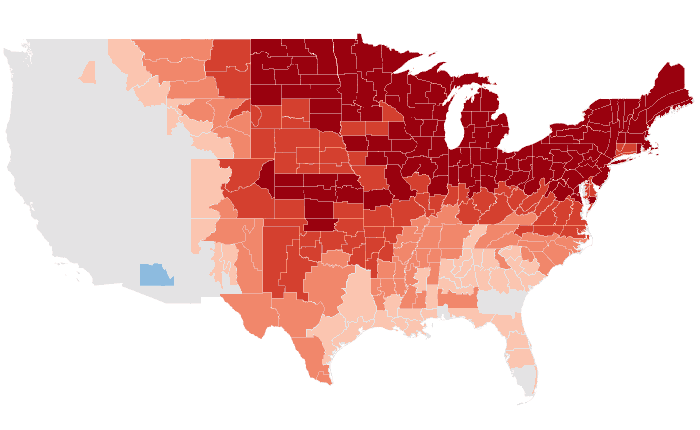
ASO 2021 issued July 2021
Temperature: 61% accurate, opposite extreme 3% (NOAA CPC 66%, 3%)
Precipitation: 47% accurate, opposite extreme 24% (NOAA CPC 22%, 40%)
Temperature


Outlooks
Probability of the favored tercile: 40, 50, 60, 70%+
Observed
Departure from normal: steps at ±0.5, 1, 2, 3°F
Precipitation
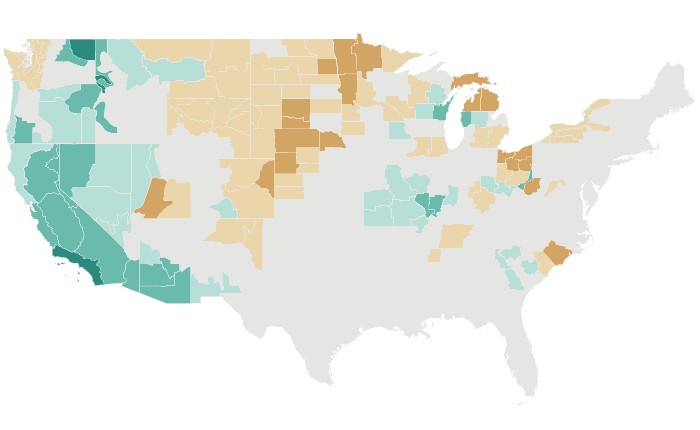

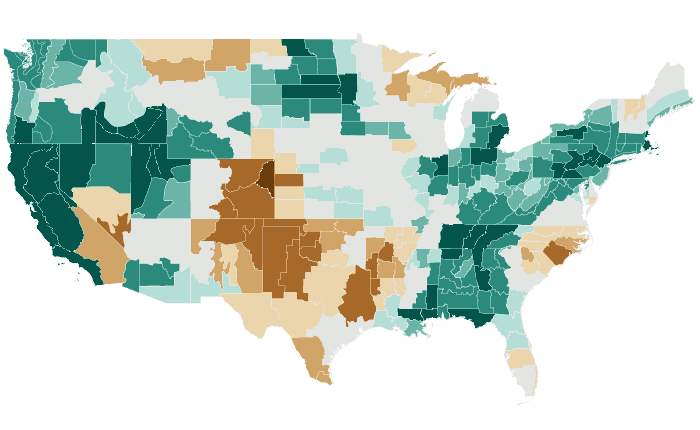
Outlooks
Probability of the favored tercile: 40, 50, 60, 70%+
Observed
Percent of normal: steps at 50, 70, 80, 90, 110, 120, 130, 150%
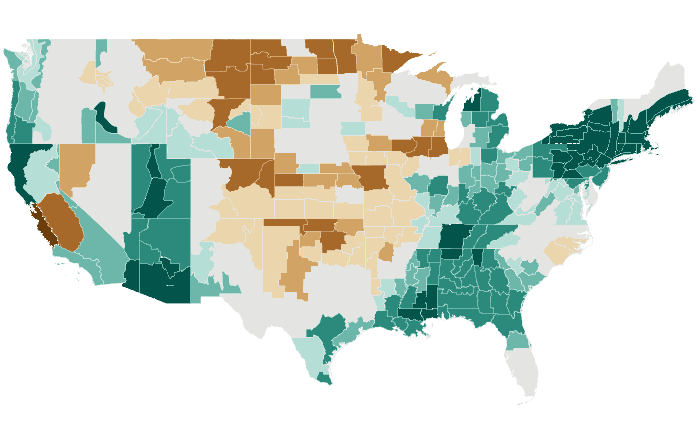
JAS 2021 issued June 2021
Temperature: 77% accurate, opposite extreme 6% (NOAA CPC 77%, 2%)
Precipitation: 49% accurate, opposite extreme 20% (NOAA CPC 42%, 25%)
Temperature


Outlooks
Probability of the favored tercile: 40, 50, 60, 70%+
Observed
Departure from normal: steps at ±0.5, 1, 2, 3°F
Precipitation
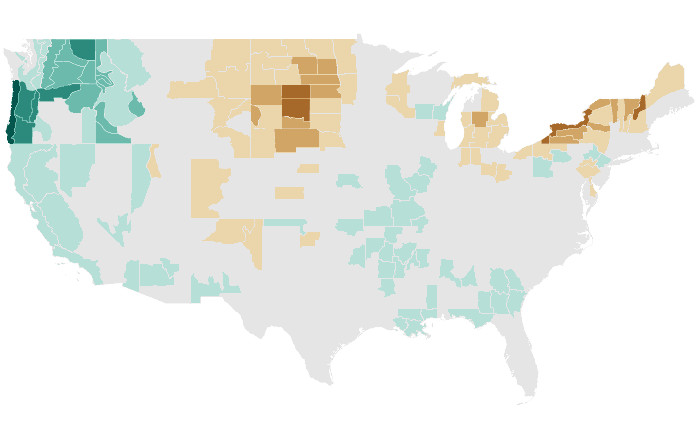
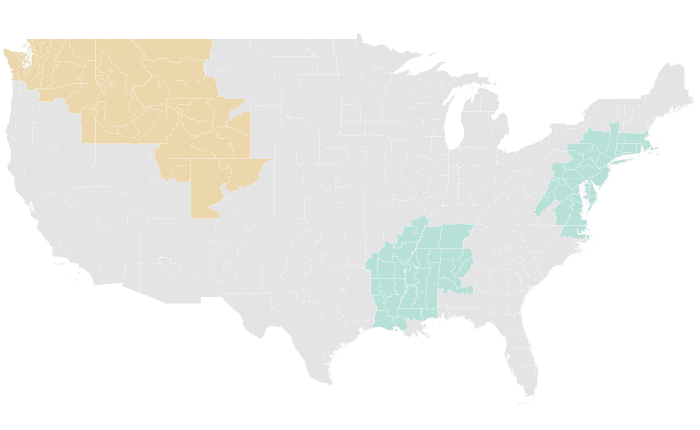
Outlooks
Probability of the favored tercile: 40, 50, 60, 70%+
Observed
Percent of normal: steps at 50, 70, 80, 90, 110, 120, 130, 150%
JJA 2021 issued May 2021
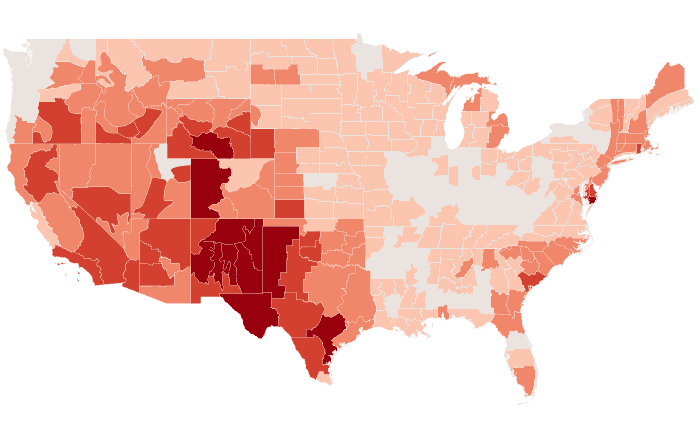
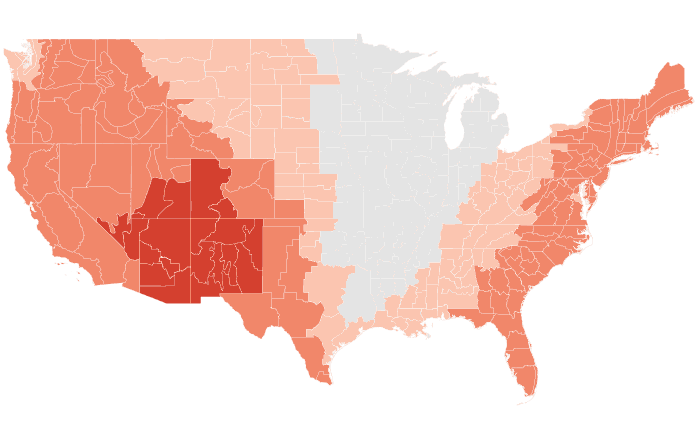
Temperature: 65% accurate, opposite extreme 12% (NOAA CPC 66%, 13%)
Precipitation: 44% accurate, opposite extreme 30% (NOAA CPC 58%, 6%)
Temperature

Outlooks
Probability of the favored tercile: 40, 50, 60, 70%+
Observed
Departure from normal: steps at ±0.5, 1, 2, 3°F
Precipitation


Outlooks
Probability of the favored tercile: 40, 50, 60, 70%+
Observed
Percent of normal: steps at 50, 70, 80, 90, 110, 120, 130, 150%
MJJ 2021 issued April 2021
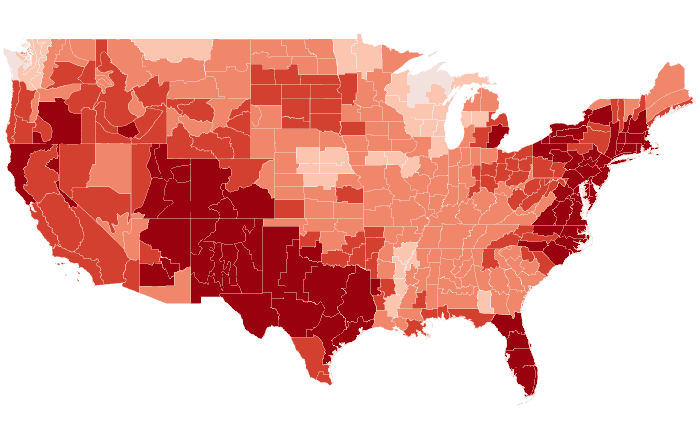
Temperature: 61% accurate, opposite extreme 16% (NOAA CPC 59%, 17%)
Precipitation: 53% accurate, opposite extreme 23% (NOAA CPC 69%, 5%)
Temperature
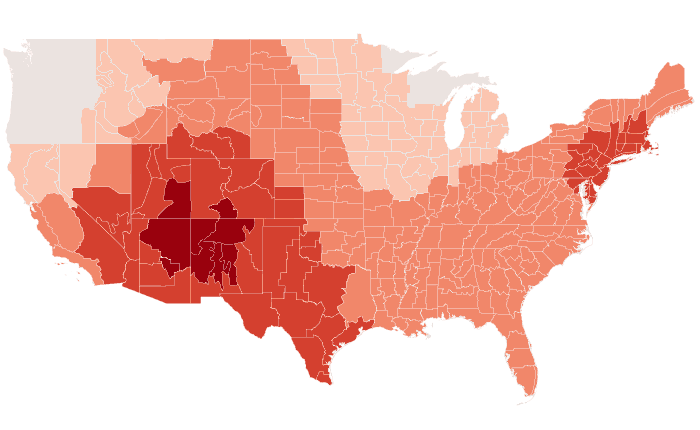
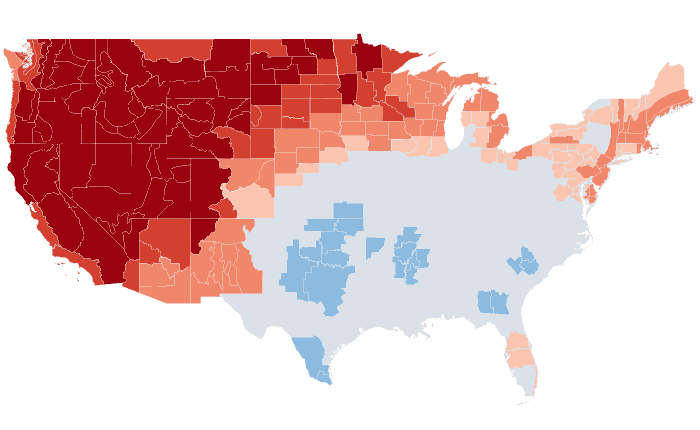
Outlooks
Probability of the favored tercile: 40, 50, 60, 70%+
Observed
Departure from normal: steps at ±0.5, 1, 2, 3°F
Precipitation
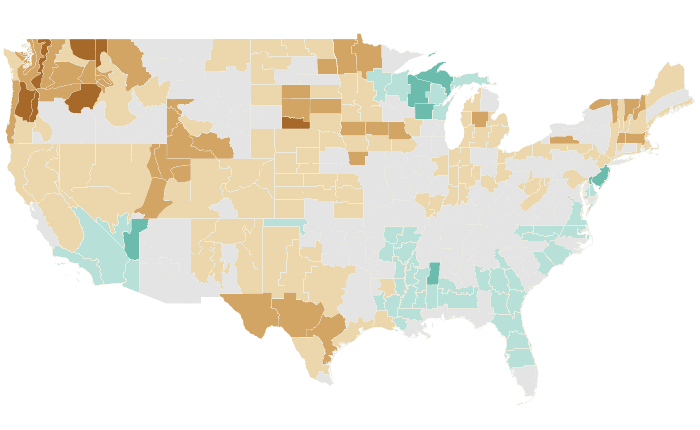
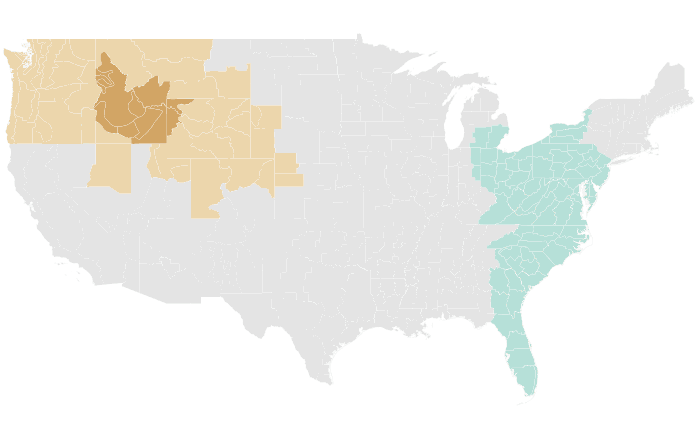

Outlooks
Probability of the favored tercile: 40, 50, 60, 70%+
Observed
Percent of normal: steps at 50, 70, 80, 90, 110, 120, 130, 150%
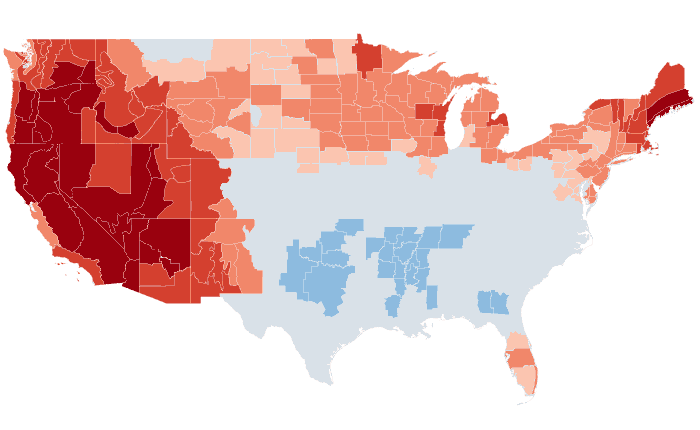
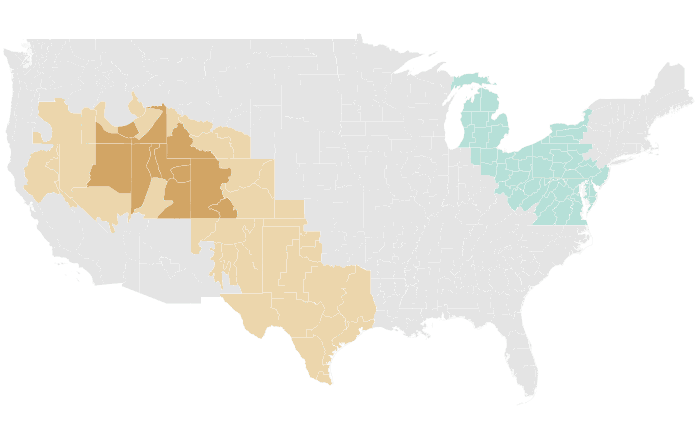
AMJ 2021 issued March 2021
Temperature: 50% accurate, opposite extreme 20% (NOAA CPC 45%, 23%)
Precipitation: 53% accurate, opposite extreme 16% (NOAA CPC 39%, 39%)
Temperature
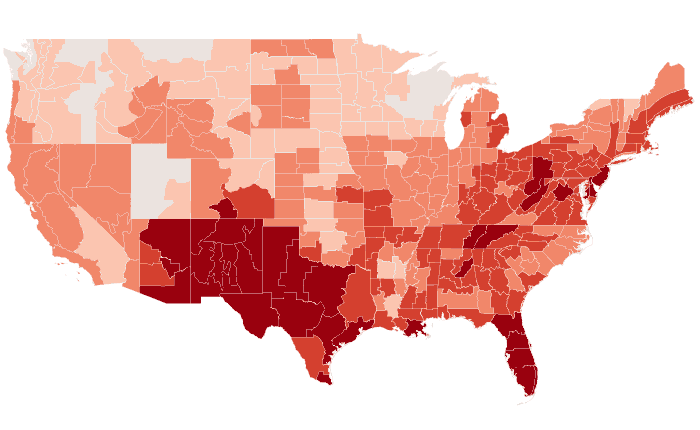
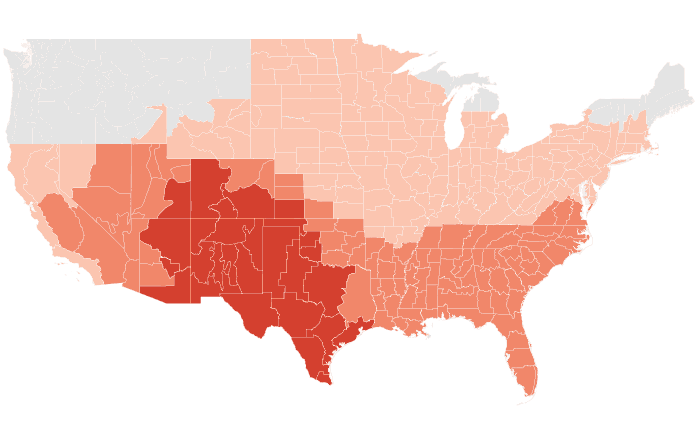
Outlooks
Probability of the favored tercile: 40, 50, 60, 70%+
Observed
Departure from normal: steps at ±0.5, 1, 2, 3°F
Precipitation
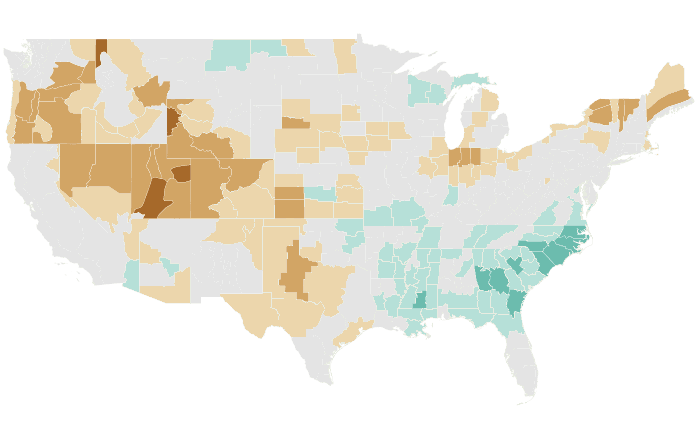

Outlooks
Probability of the favored tercile: 40, 50, 60, 70%+
Observed
Percent of normal: steps at 50, 70, 80, 90, 110, 120, 130, 150%
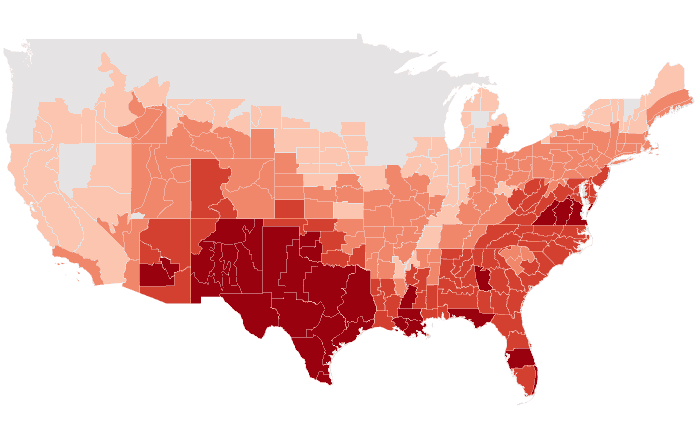
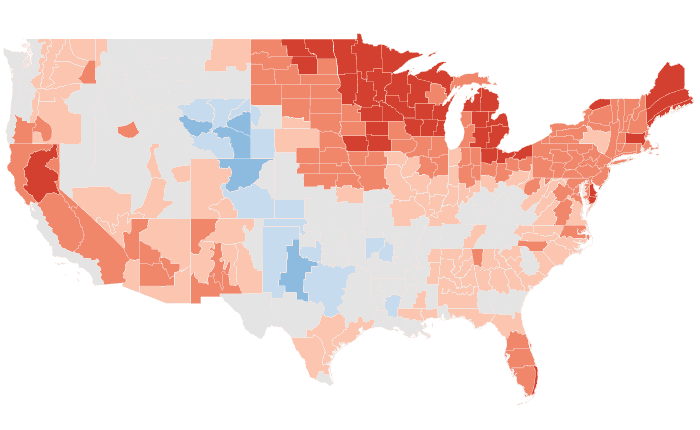
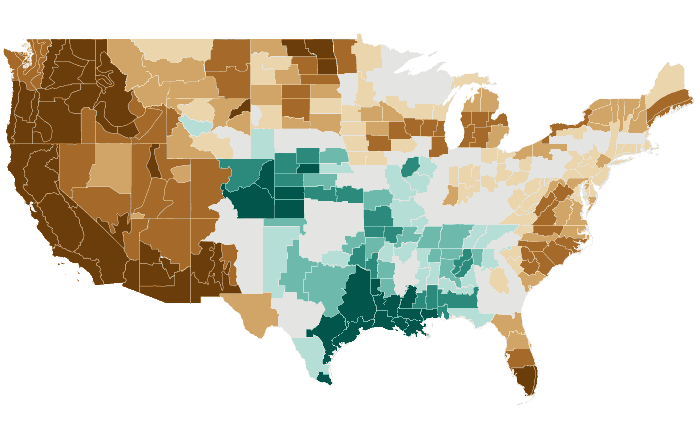
MAM 2021 issued February 2021
Temperature: 32% accurate, opposite extreme 8% (NOAA CPC 26%, 11%)
Precipitation: 55% accurate, opposite extreme 20% (NOAA CPC 38%, 40%)
Temperature

Outlooks
Probability of the favored tercile: 40, 50, 60, 70%+
Observed
Departure from normal: steps at ±0.5, 1, 2, 3°F
Precipitation


Outlooks
Probability of the favored tercile: 40, 50, 60, 70%+
Observed
Percent of normal: steps at 50, 70, 80, 90, 110, 120, 130, 150%
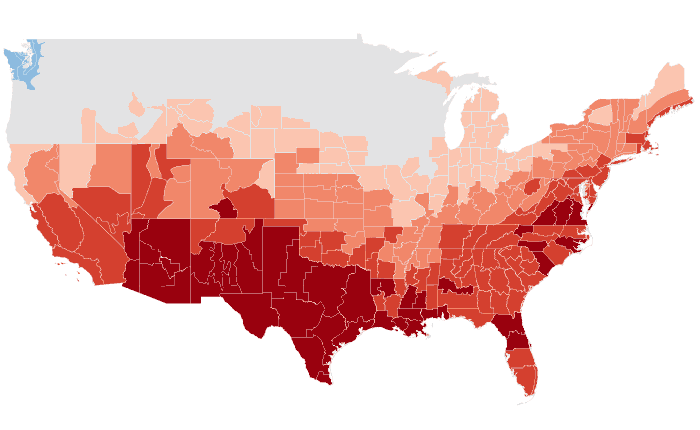
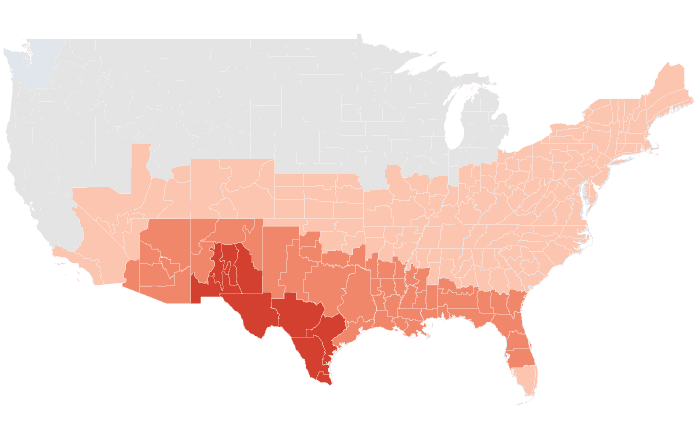
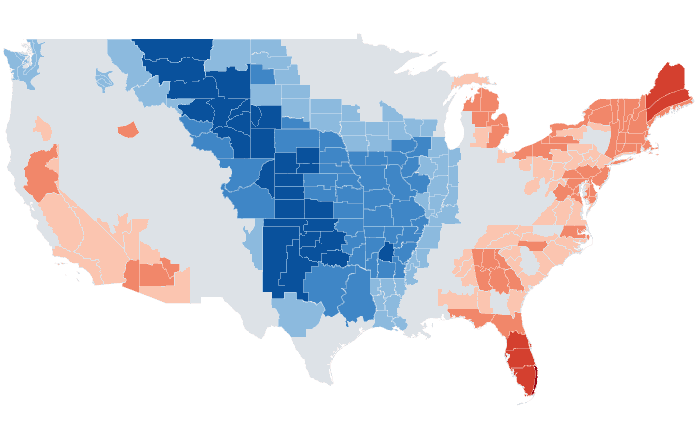
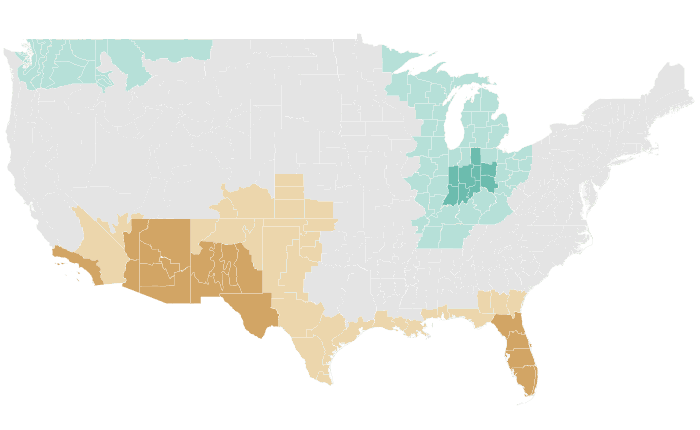
FMA 2021 issued January 2021
Temperature: 25% accurate, opposite extreme 40% (NOAA CPC 25%, 40%)
Precipitation: 57% accurate, opposite extreme 22% (NOAA CPC 54%, 26%)
Temperature
Outlooks
Probability of the favored tercile: 40, 50, 60, 70%+
Observed
Departure from normal: steps at ±0.5, 1, 2, 3°F
Precipitation


Outlooks
Probability of the favored tercile: 40, 50, 60, 70%+
Observed
Percent of normal: steps at 50, 70, 80, 90, 110, 120, 130, 150%
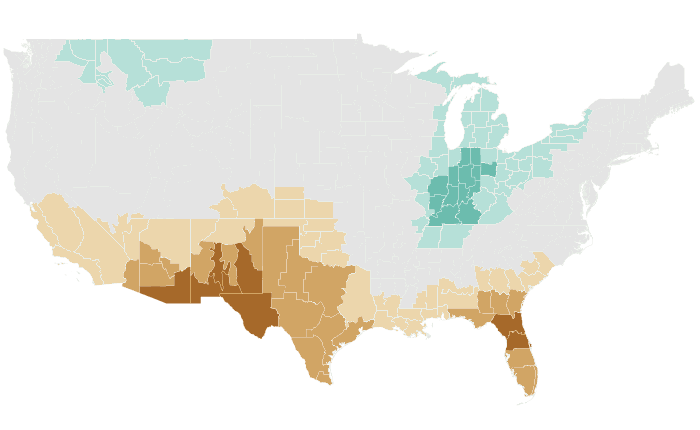
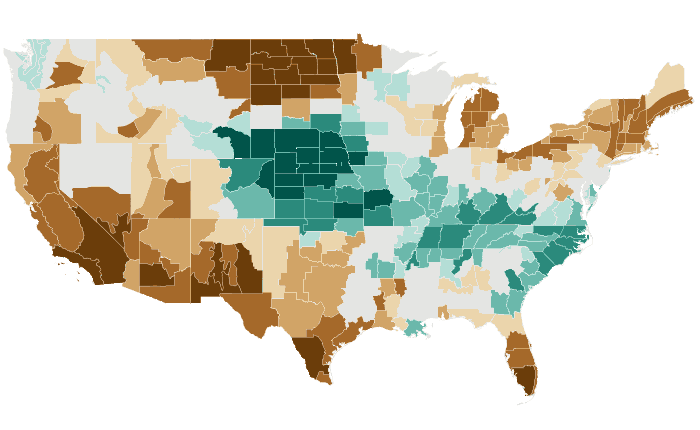
JFM 2021 issued December 2020
Temperature: 25% accurate, opposite extreme 19% (NOAA CPC 25%, 17%)
Precipitation: 46% accurate, opposite extreme 22% (NOAA CPC 49%, 25%)
Temperature
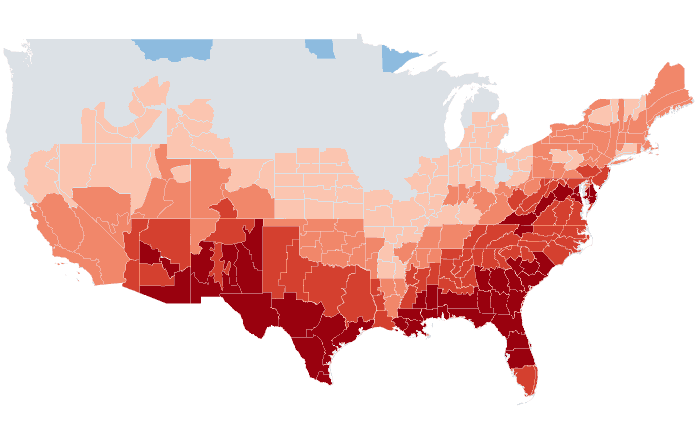
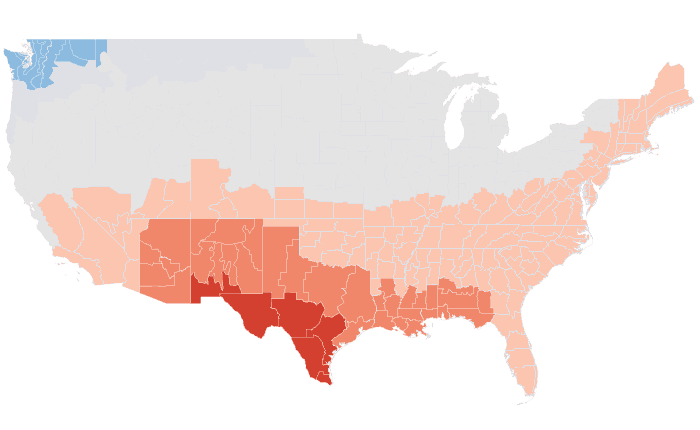
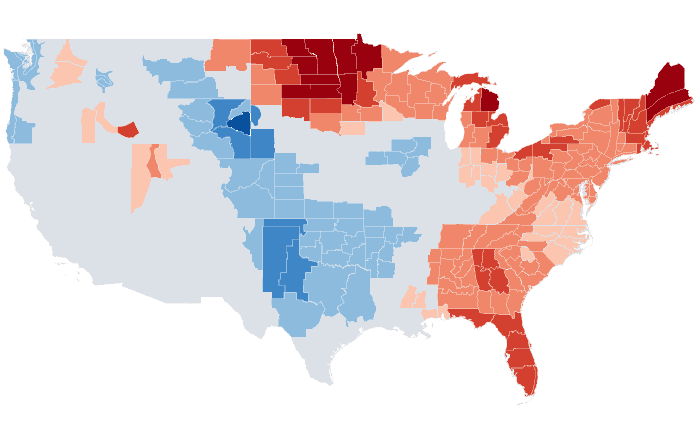
Outlooks
Probability of the favored tercile: 40, 50, 60, 70%+
Observed
Departure from normal: steps at ±0.5, 1, 2, 3°F
Precipitation
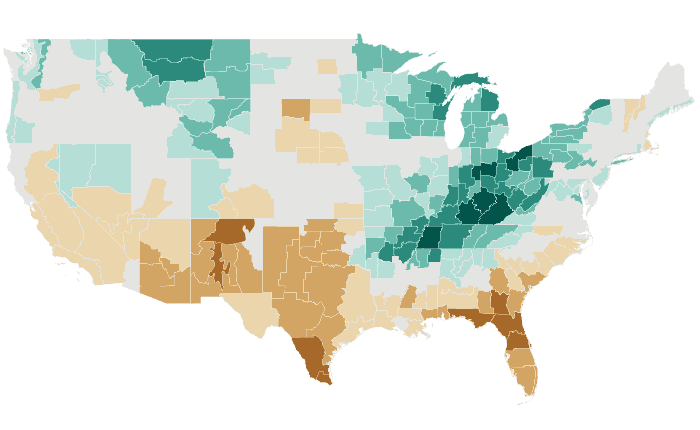
Outlooks
Probability of the favored tercile: 40, 50, 60, 70%+
Observed
Percent of normal: steps at 50, 70, 80, 90, 110, 120, 130, 150%
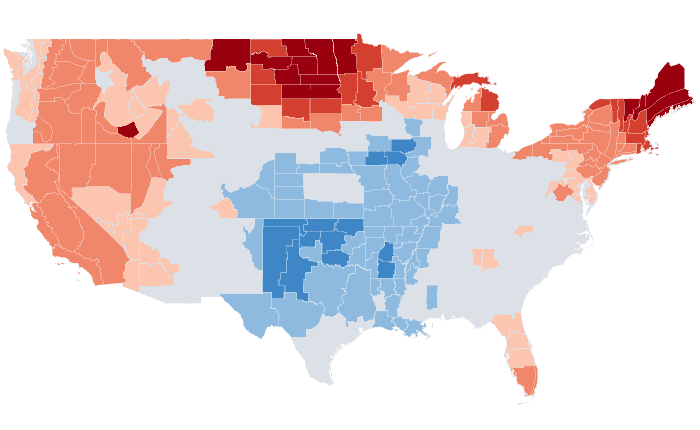
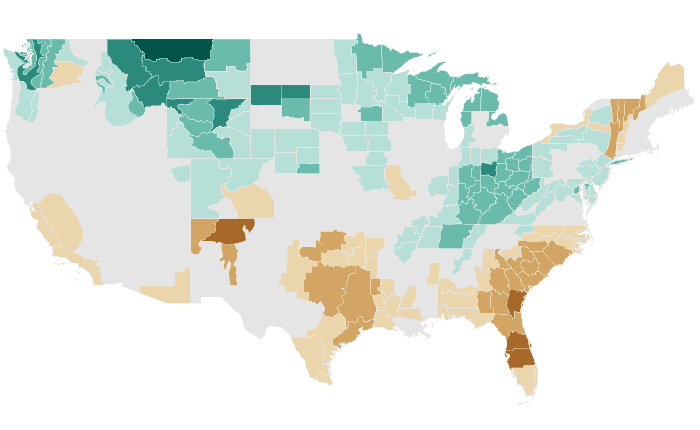
DJF 2020-21 issued November 2020
Temperature: 31% accurate, opposite extreme 20% (NOAA CPC 22%, 35%)
Precipitation: 36% accurate, opposite extreme 23% (NOAA CPC 40%, 25%)
Temperature


Outlooks
Probability of the favored tercile: 40, 50, 60, 70%+
Observed
Departure from normal: steps at ±0.5, 1, 2, 3°F
Precipitation
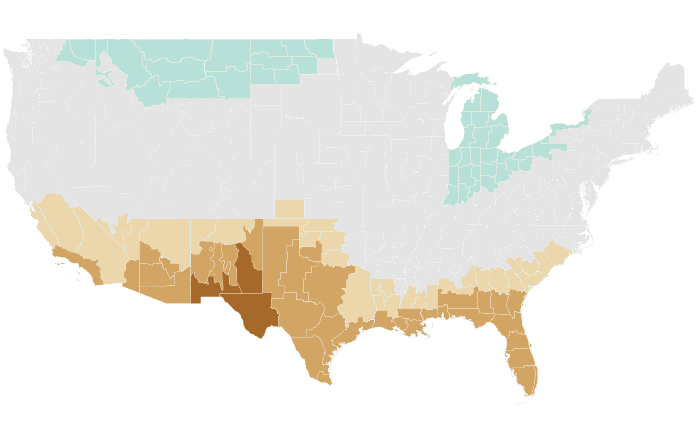
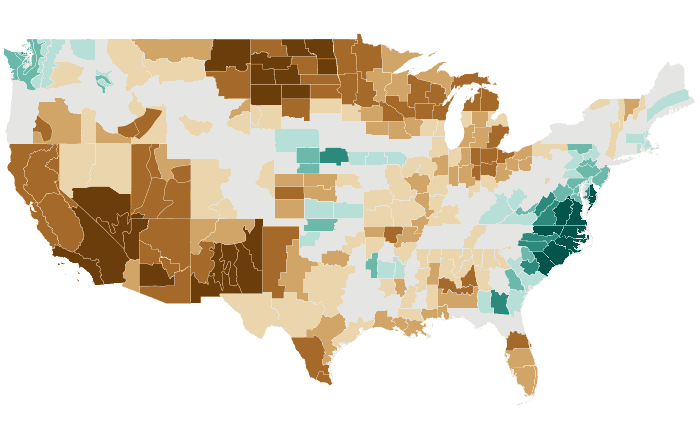
Outlooks
Probability of the favored tercile: 40, 50, 60, 70%+
Observed
Percent of normal: steps at 50, 70, 80, 90, 110, 120, 130, 150%
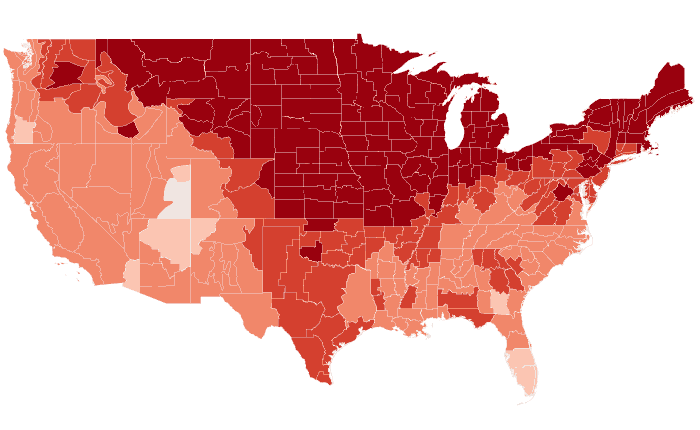
NDJ 2020-21 issued October 2020
Temperature: 90% accurate, opposite extreme 0% (NOAA CPC 95%, 0%)
Precipitation: 41% accurate, opposite extreme 14% (NOAA CPC 40%, 18%)
Temperature

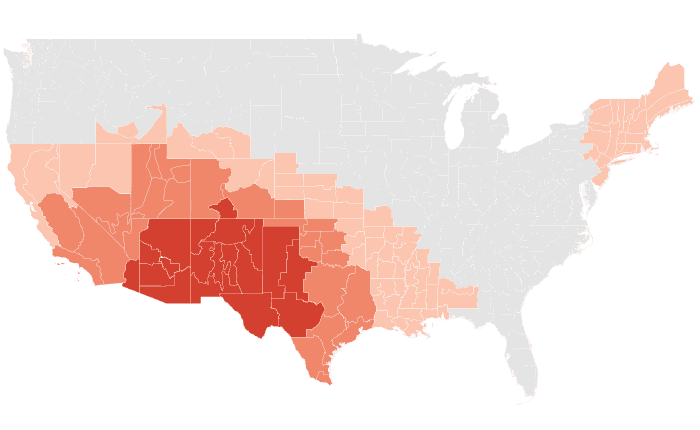
Outlooks
Probability of the favored tercile: 40, 50, 60, 70%+
Observed
Departure from normal: steps at ±0.5, 1, 2, 3°F
Precipitation


Outlooks
Probability of the favored tercile: 40, 50, 60, 70%+
Observed
Percent of normal: steps at 50, 70, 80, 90, 110, 120, 130, 150%
OND 2020 issued September 2020
Temperature: 95% accurate, opposite extreme 1% (NOAA CPC 97%, 0%)
Precipitation: 52% accurate, opposite extreme 6% (NOAA CPC 73%, 2%)
Temperature
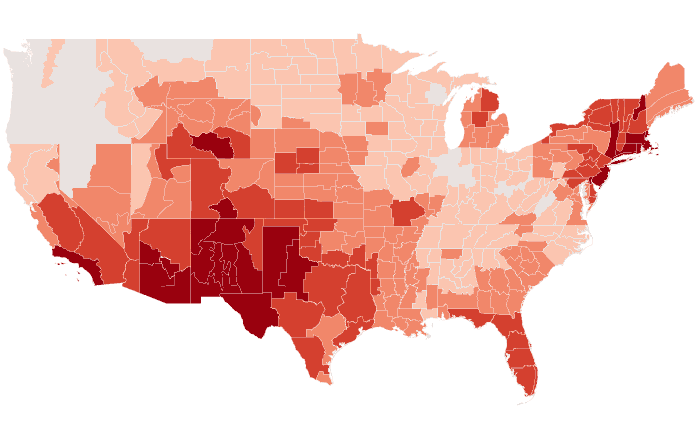
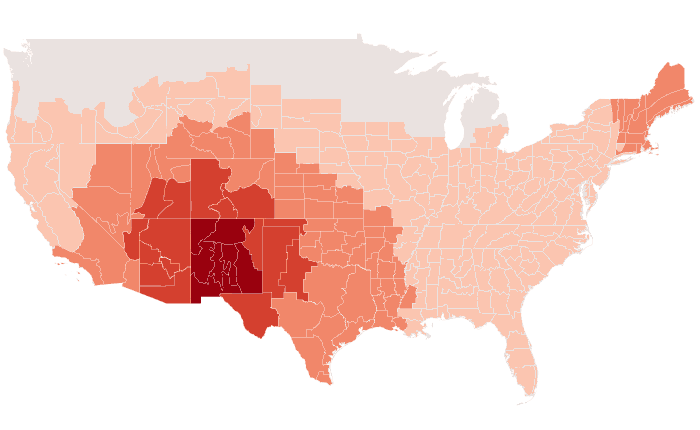

Outlooks
Probability of the favored tercile: 40, 50, 60, 70%+
Observed
Departure from normal: steps at ±0.5, 1, 2, 3°F
Precipitation
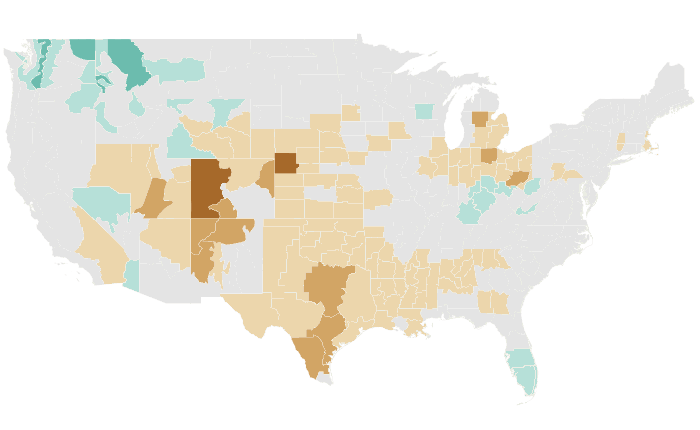
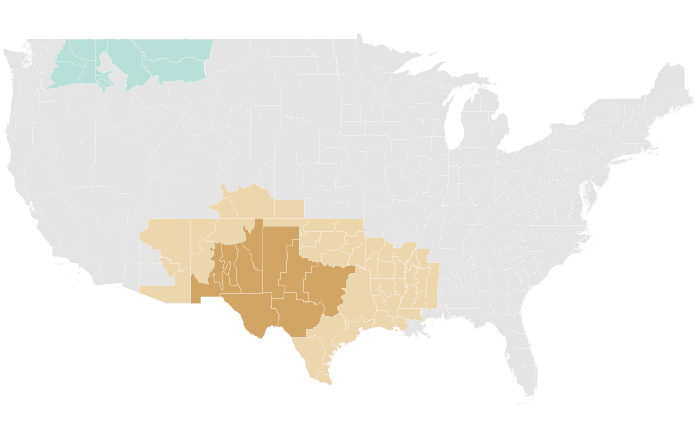

Outlooks
Probability of the favored tercile: 40, 50, 60, 70%+
Observed
Percent of normal: steps at 50, 70, 80, 90, 110, 120, 130, 150%
SON 2020 issued August 2020
Temperature: 66% accurate, opposite extreme 1% (NOAA CPC 81%, 0%)
Precipitation: 58% accurate, opposite extreme 6% (NOAA CPC 65%, 4%)
Temperature


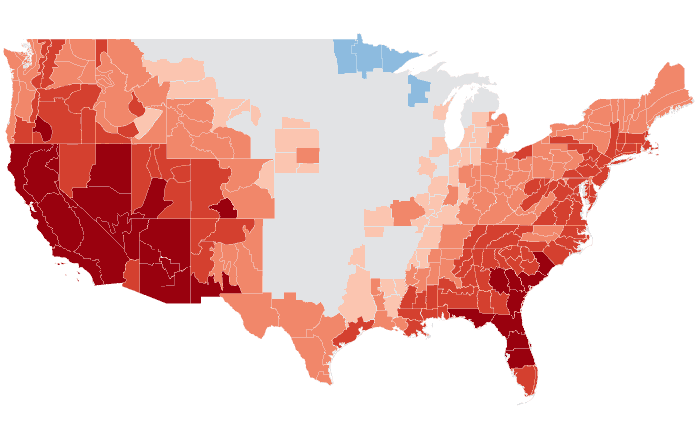
Outlooks
Probability of the favored tercile: 40, 50, 60, 70%+
Observed
Departure from normal: steps at ±0.5, 1, 2, 3°F
Precipitation
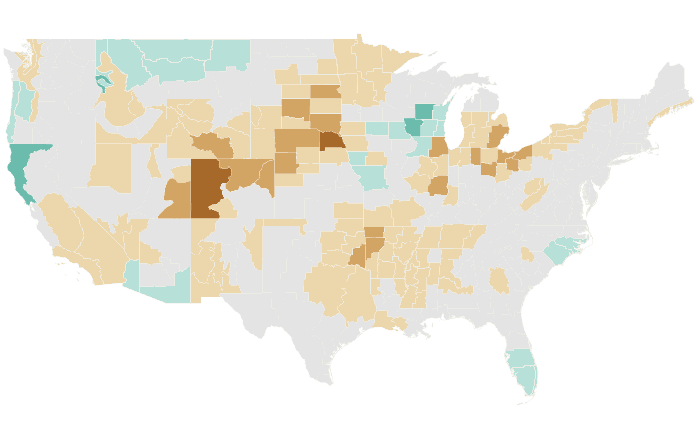
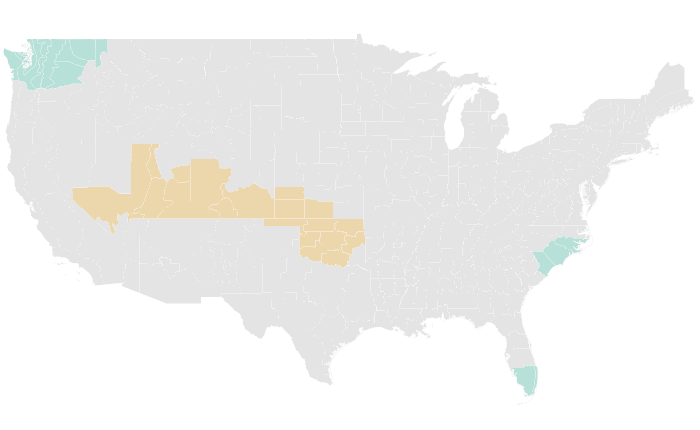
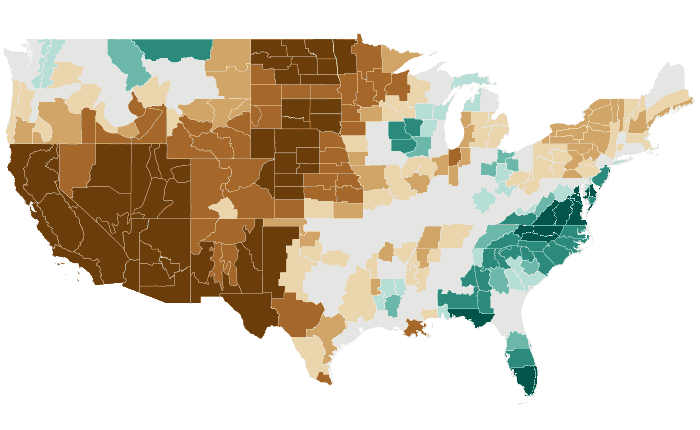
Outlooks
Probability of the favored tercile: 40, 50, 60, 70%+
Observed
Percent of normal: steps at 50, 70, 80, 90, 110, 120, 130, 150%
ASO 2020 issued July 2020
Temperature: 60% accurate, opposite extreme 25% (NOAA CPC 69%, 16%)
Precipitation: 51% accurate, opposite extreme 23% (NOAA CPC 78%, 17%)
Temperature

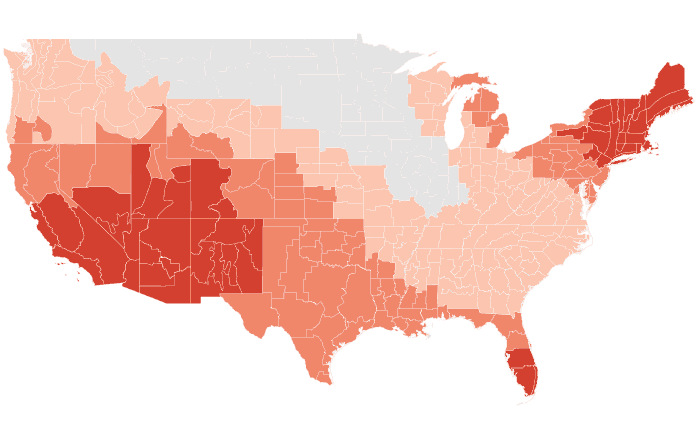

Outlooks
Probability of the favored tercile: 40, 50, 60, 70%+
Observed
Departure from normal: steps at ±0.5, 1, 2, 3°F
Precipitation

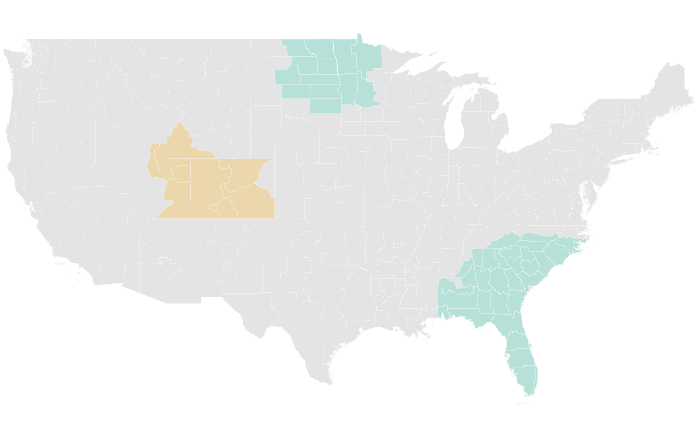

Outlooks
Probability of the favored tercile: 40, 50, 60, 70%+
Observed
Percent of normal: steps at 50, 70, 80, 90, 110, 120, 130, 150%
JAS 2020 issued June 2020
Temperature: 76% accurate, opposite extreme 1% (NOAA CPC 87%, 1%)
Precipitation: 50% accurate, opposite extreme 22% (NOAA CPC 86%, 0%)
Temperature
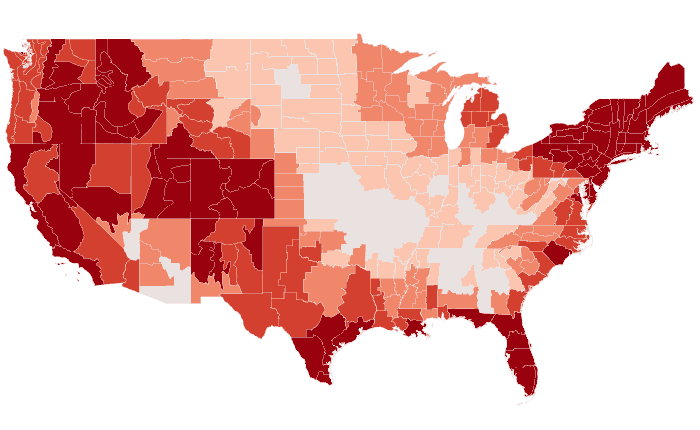


Outlooks
Probability of the favored tercile: 40, 50, 60, 70%+
Observed
Departure from normal: steps at ±0.5, 1, 2, 3°F
Precipitation
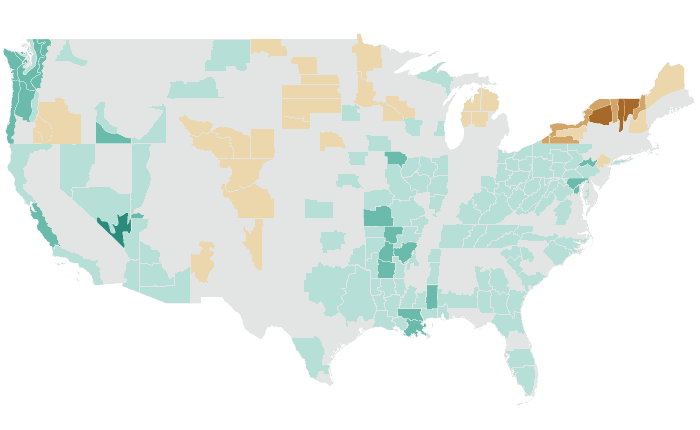
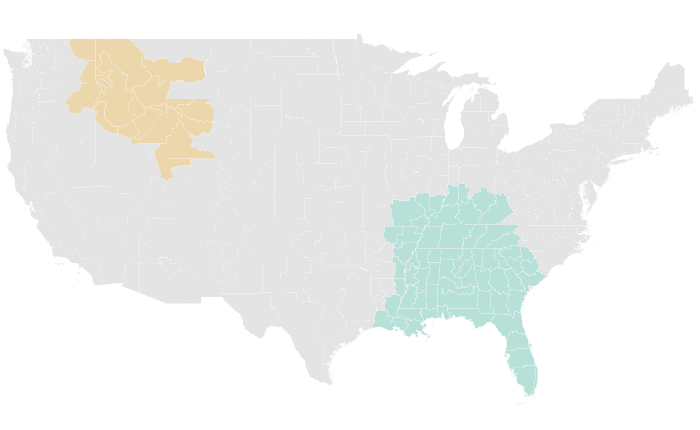
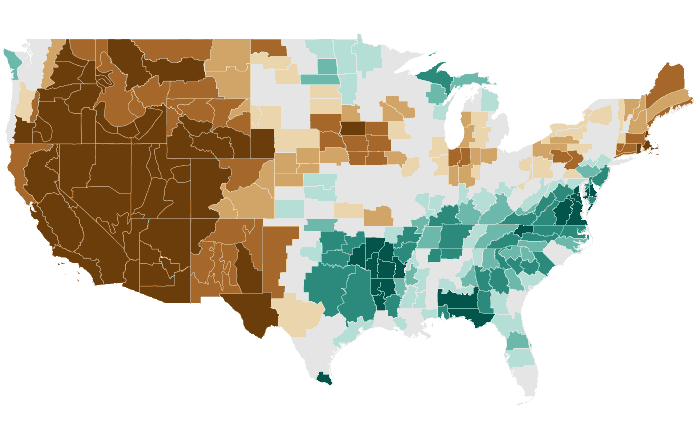
Outlooks
Probability of the favored tercile: 40, 50, 60, 70%+
Observed
Percent of normal: steps at 50, 70, 80, 90, 110, 120, 130, 150%
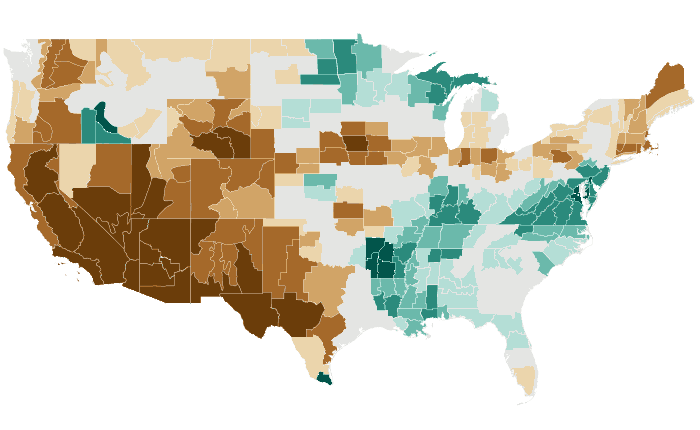
JJA 2020 issued May 2020
Temperature: 82% accurate, opposite extreme 2% (NOAA CPC 84%, 0%)
Precipitation: 45% accurate, opposite extreme 27% (NOAA CPC 58%, 15%)
Temperature
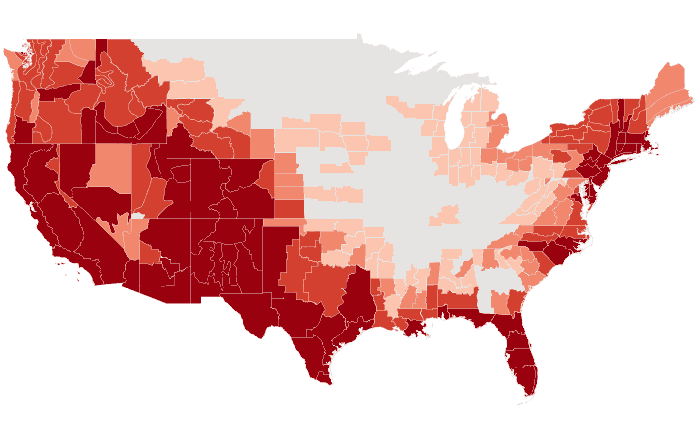


Outlooks
Probability of the favored tercile: 40, 50, 60, 70%+
Observed
Departure from normal: steps at ±0.5, 1, 2, 3°F
Precipitation
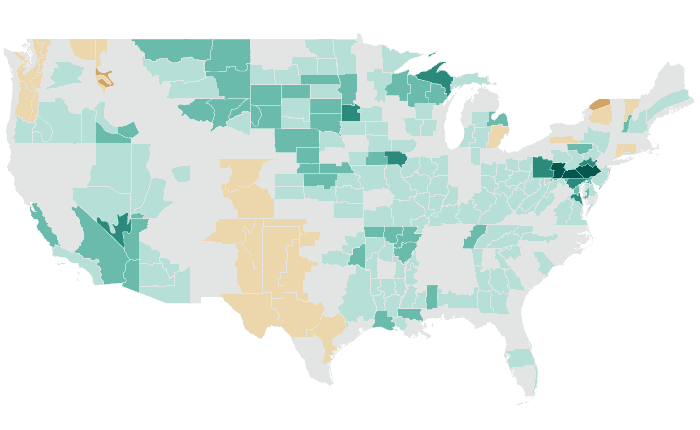
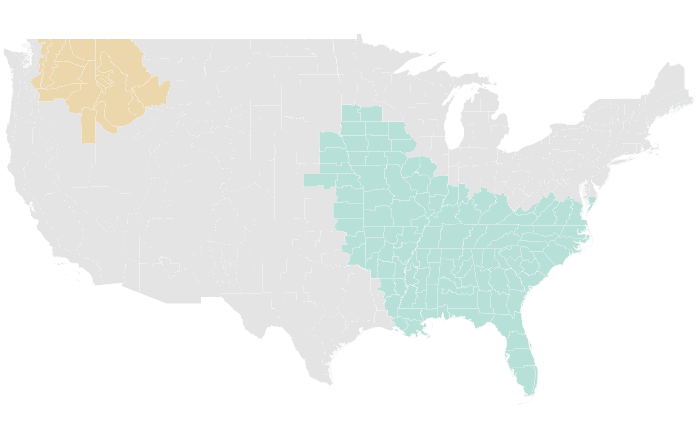
Outlooks
Probability of the favored tercile: 40, 50, 60, 70%+
Observed
Percent of normal: steps at 50, 70, 80, 90, 110, 120, 130, 150%
MJJ 2020 issued April 2020
Temperature: 62% accurate, opposite extreme 2% (NOAA CPC 61%, 2%)
Precipitation: 39% accurate, opposite extreme 36% (NOAA CPC 32%, 19%)
Temperature

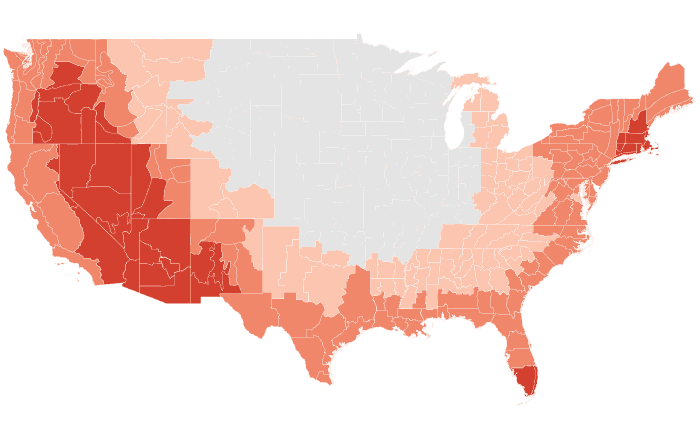

Outlooks
Probability of the favored tercile: 40, 50, 60, 70%+
Observed
Departure from normal: steps at ±0.5, 1, 2, 3°F
Precipitation
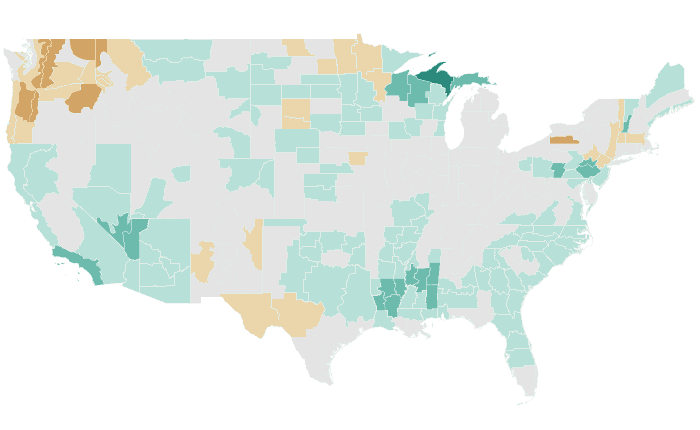


Outlooks
Probability of the favored tercile: 40, 50, 60, 70%+
Observed
Percent of normal: steps at 50, 70, 80, 90, 110, 120, 130, 150%
AMJ 2020 issued March 2020
Temperature: 36% accurate, opposite extreme 26% (NOAA CPC 41%, 31%)
Precipitation: 39% accurate, opposite extreme 23% (NOAA CPC 45%, 19%)
Temperature
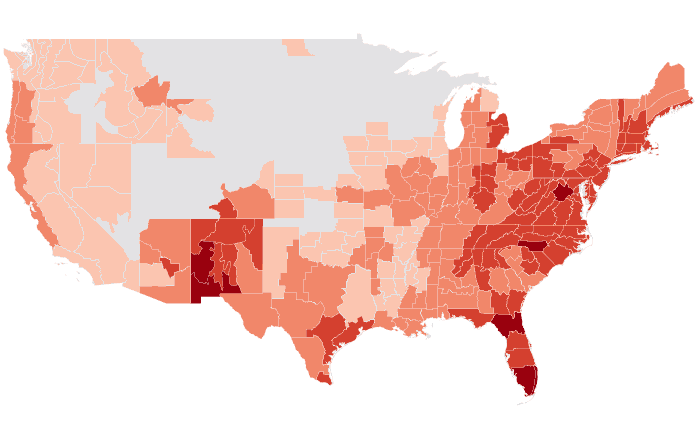
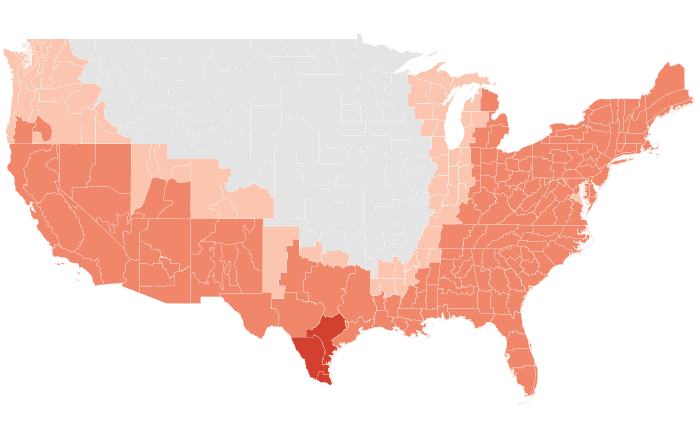

Outlooks
Probability of the favored tercile: 40, 50, 60, 70%+
Observed
Departure from normal: steps at ±0.5, 1, 2, 3°F
Precipitation
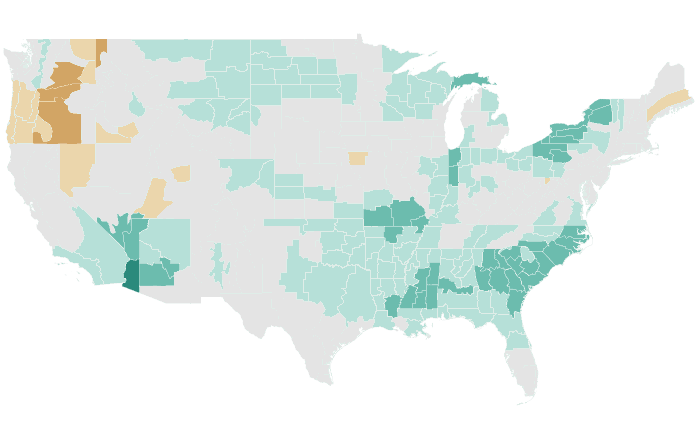


Outlooks
Probability of the favored tercile: 40, 50, 60, 70%+
Observed
Percent of normal: steps at 50, 70, 80, 90, 110, 120, 130, 150%
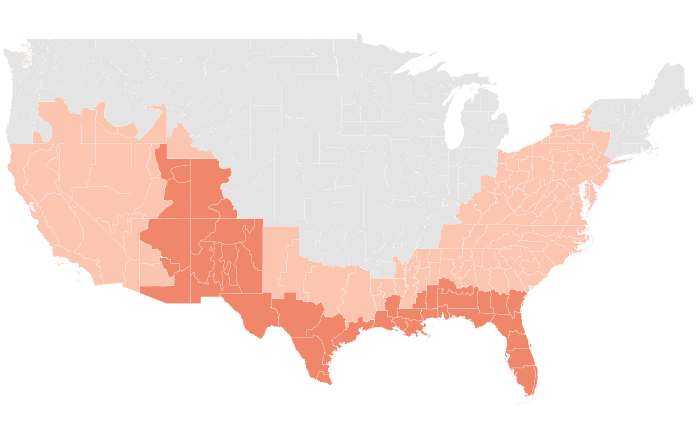
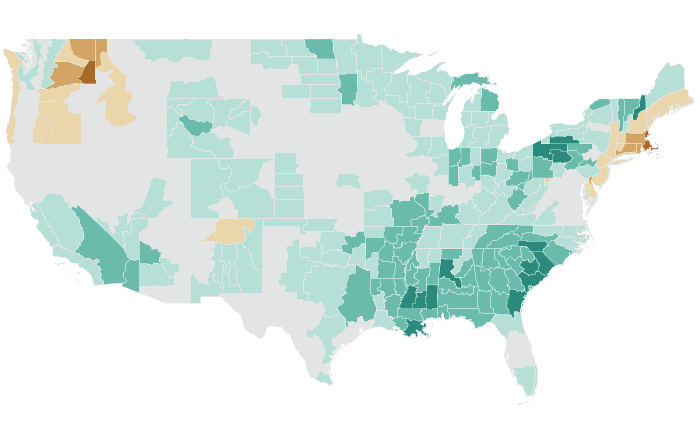
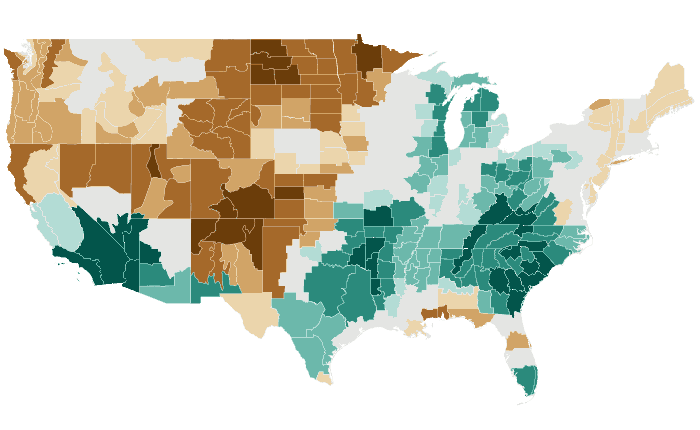
MAM 2020 issued February 2020
Temperature: 57% accurate, opposite extreme 1% (NOAA CPC 65%, 0%)
Precipitation: 57% accurate, opposite extreme 23% (NOAA CPC 58%, 20%)
Temperature
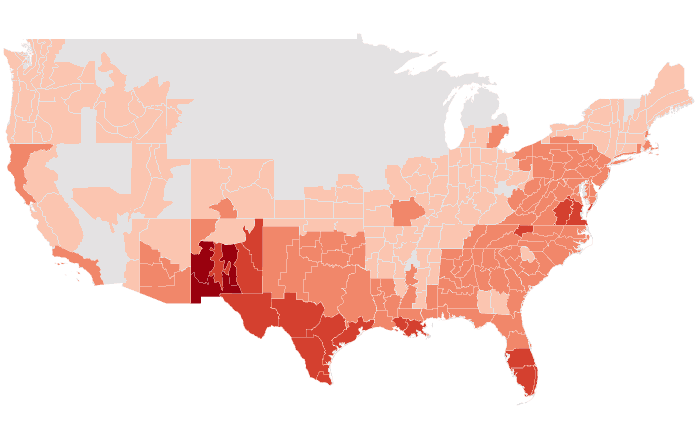

Outlooks
Probability of the favored tercile: 40, 50, 60, 70%+
Observed
Departure from normal: steps at ±0.5, 1, 2, 3°F
Precipitation

Outlooks
Probability of the favored tercile: 40, 50, 60, 70%+
Observed
Percent of normal: steps at 50, 70, 80, 90, 110, 120, 130, 150%
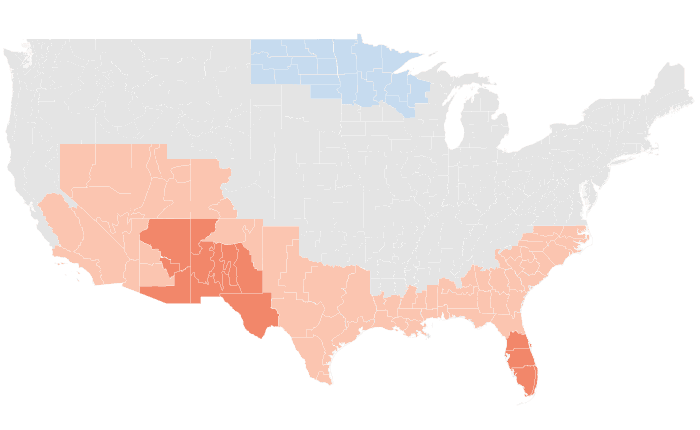
FMA 2020 issued January 2020
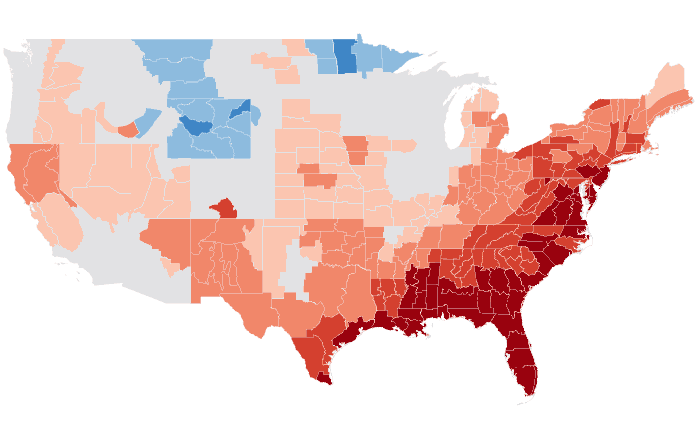
Temperature: 65% accurate, opposite extreme 3% (NOAA CPC 63%, 0%)
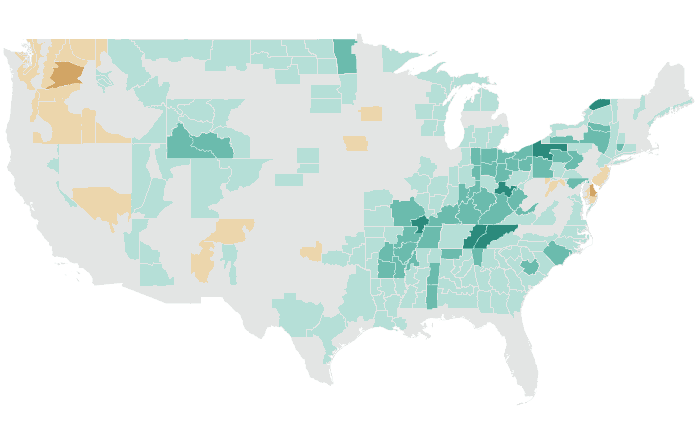
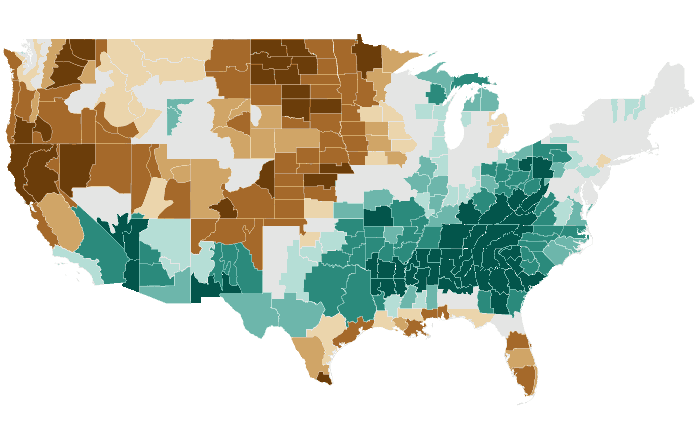
Precipitation: 55% accurate, opposite extreme 19% (NOAA CPC 33%, 58%)
Temperature

Outlooks
Probability of the favored tercile: 40, 50, 60, 70%+
Observed
Departure from normal: steps at ±0.5, 1, 2, 3°F
Precipitation

Outlooks
Probability of the favored tercile: 40, 50, 60, 70%+
Observed
Percent of normal: steps at 50, 70, 80, 90, 110, 120, 130, 150%
JFM 2020 issued December 2019
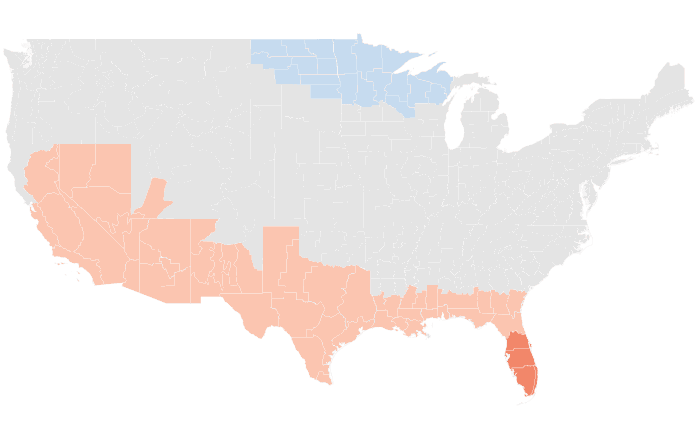
Temperature: 65% accurate, opposite extreme 9% (NOAA CPC 68%, 9%)
Precipitation: 49% accurate, opposite extreme 20% (NOAA CPC 53%, 18%)
Temperature

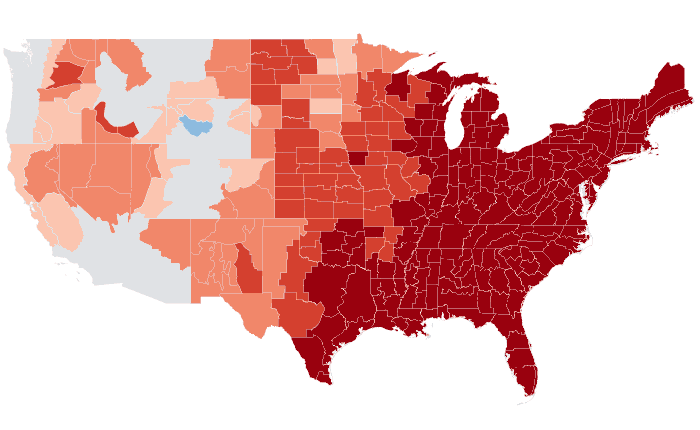
Outlooks
Probability of the favored tercile: 40, 50, 60, 70%+
Observed
Departure from normal: steps at ±0.5, 1, 2, 3°F
Precipitation

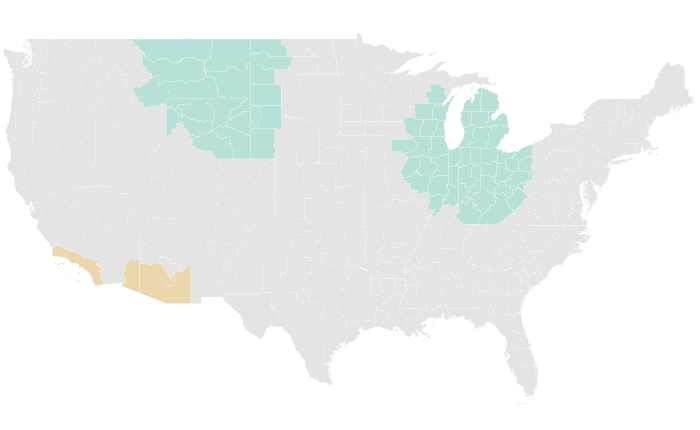

Outlooks
Probability of the favored tercile: 40, 50, 60, 70%+
Observed
Percent of normal: steps at 50, 70, 80, 90, 110, 120, 130, 150%
DJF 2019-20 issued November 2019
Temperature: 77% accurate, opposite extreme 5% (NOAA CPC 87%, 2%)
Precipitation: 48% accurate, opposite extreme 18% (NOAA CPC 61%, 7%)
Temperature
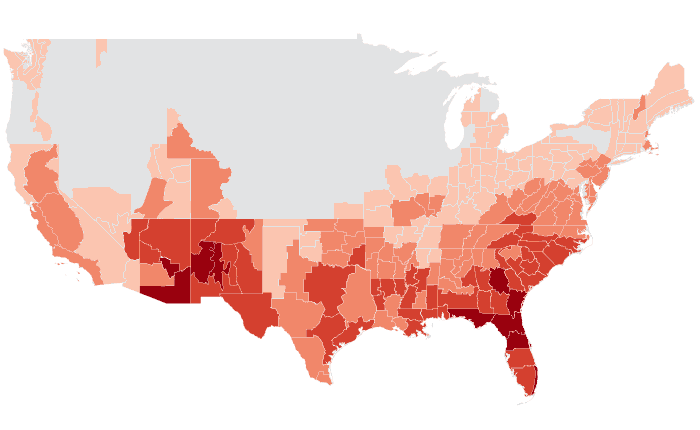
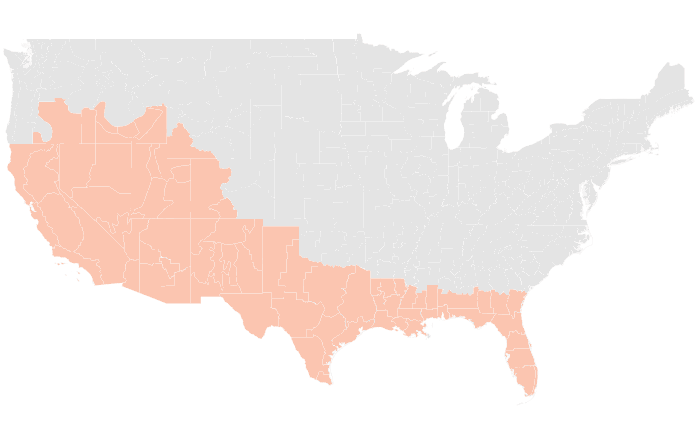

Outlooks
Probability of the favored tercile: 40, 50, 60, 70%+
Observed
Departure from normal: steps at ±0.5, 1, 2, 3°F
Precipitation


Outlooks
Probability of the favored tercile: 40, 50, 60, 70%+
Observed
Percent of normal: steps at 50, 70, 80, 90, 110, 120, 130, 150%
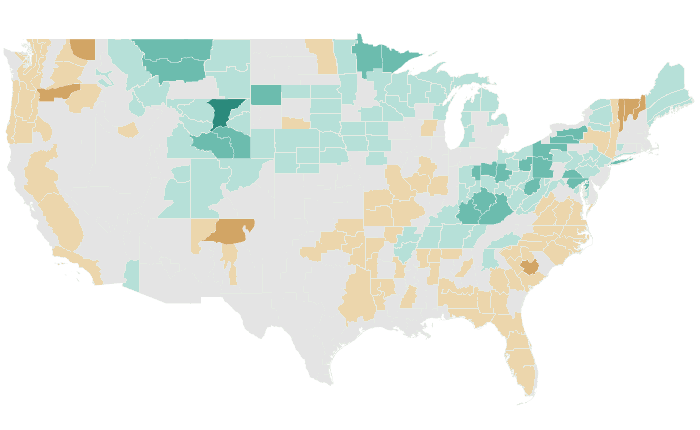
NDJ 2019-20 issued October 2019
Temperature: 85% accurate, opposite extreme 0% (NOAA CPC 91%, 0%)
Precipitation: 46% accurate, opposite extreme 15% (NOAA CPC 49%, 15%)
Temperature

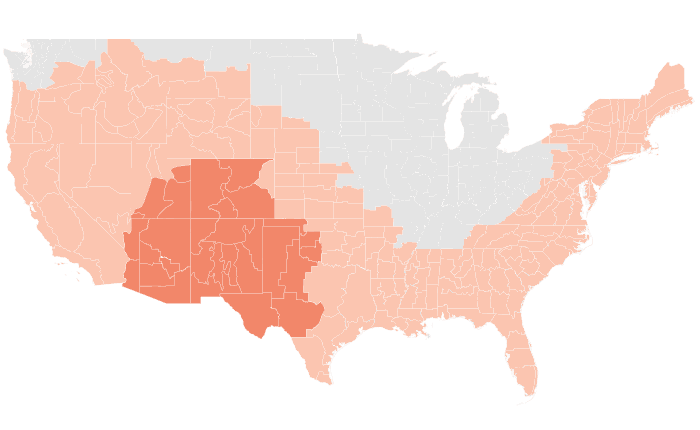

Outlooks
Probability of the favored tercile: 40, 50, 60, 70%+
Observed
Departure from normal: steps at ±0.5, 1, 2, 3°F
Precipitation
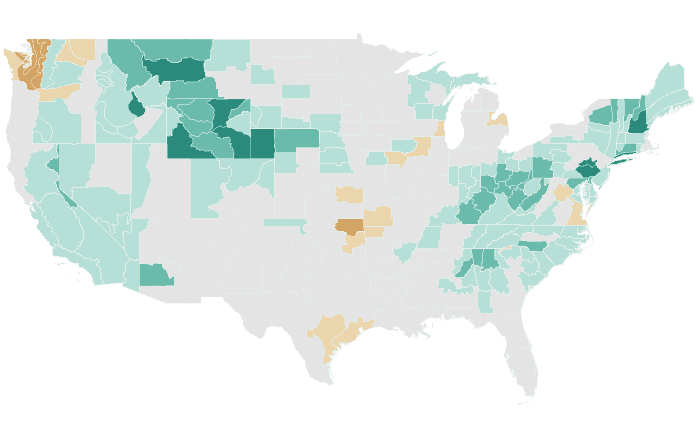


Outlooks
Probability of the favored tercile: 40, 50, 60, 70%+
Observed
Percent of normal: steps at 50, 70, 80, 90, 110, 120, 130, 150%
OND 2019 issued September 2019
Temperature: 19% accurate, opposite extreme 30% (NOAA CPC 17%, 28%)
Precipitation: 41% accurate, opposite extreme 16% (NOAA CPC 36%, 13%)
Temperature
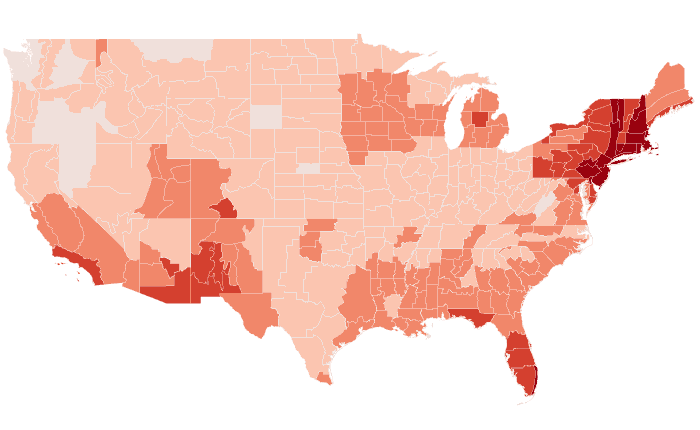
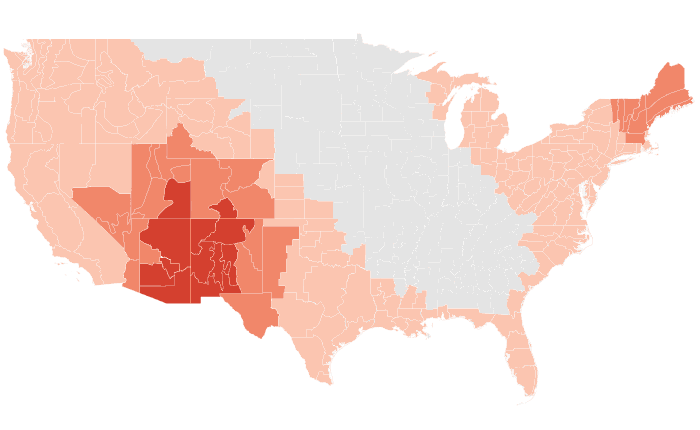

Outlooks
Probability of the favored tercile: 40, 50, 60, 70%+
Observed
Departure from normal: steps at ±0.5, 1, 2, 3°F
Precipitation


Outlooks
Probability of the favored tercile: 40, 50, 60, 70%+
Observed
Percent of normal: steps at 50, 70, 80, 90, 110, 120, 130, 150%
SON 2019 issued August 2019
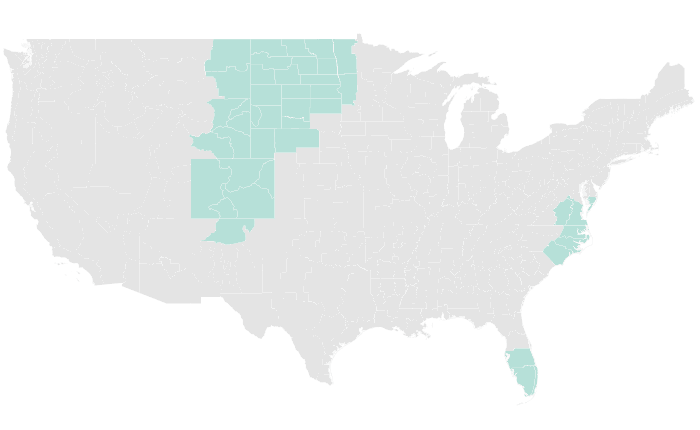
Temperature: 35% accurate, opposite extreme 31% (NOAA CPC 36%, 31%)
Precipitation: 53% accurate, opposite extreme 12% (NOAA CPC 53%, 30%)
Temperature
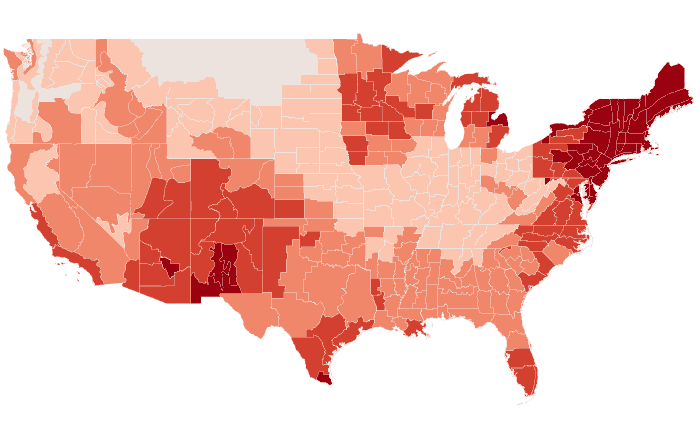

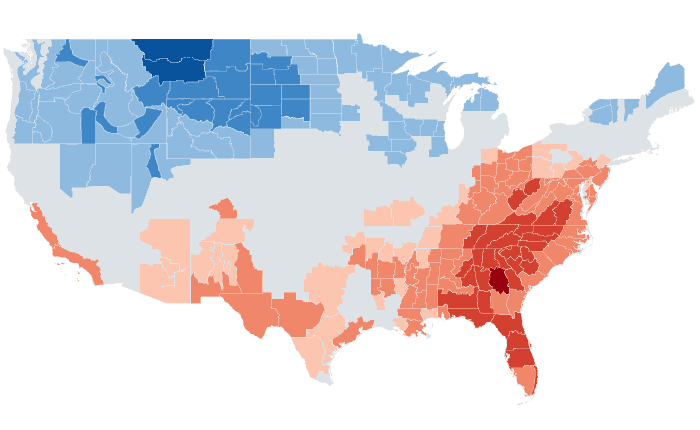
Outlooks
Probability of the favored tercile: 40, 50, 60, 70%+
Observed
Departure from normal: steps at ±0.5, 1, 2, 3°F
Precipitation
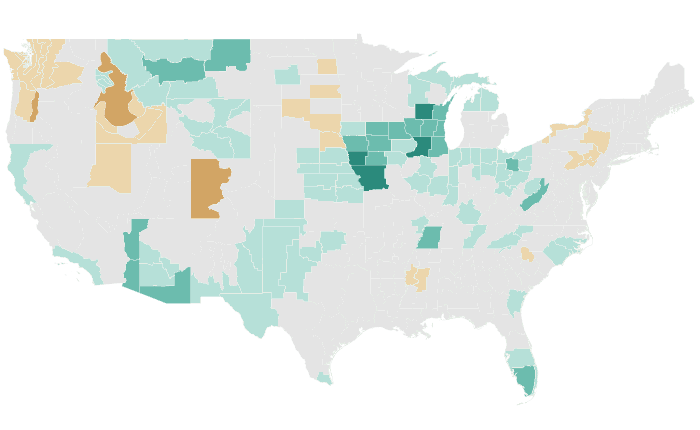

Outlooks
Probability of the favored tercile: 40, 50, 60, 70%+
Observed
Percent of normal: steps at 50, 70, 80, 90, 110, 120, 130, 150%
ASO 2019 issued July 2019
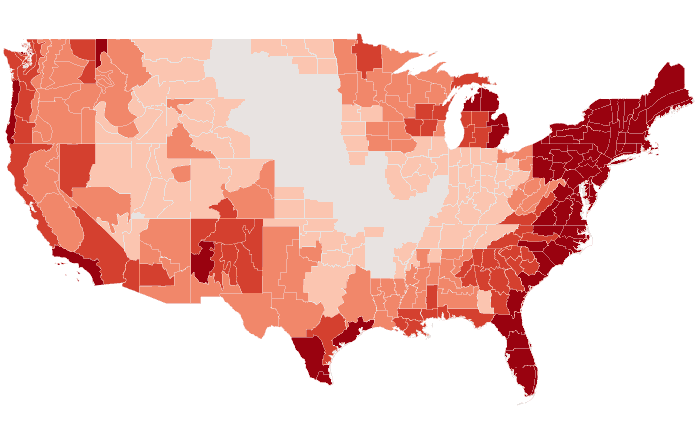
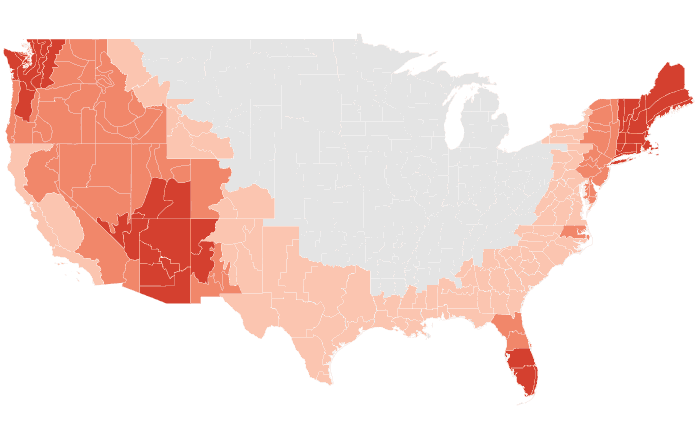
Temperature: 56% accurate, opposite extreme 26% (NOAA CPC 56%, 29%)
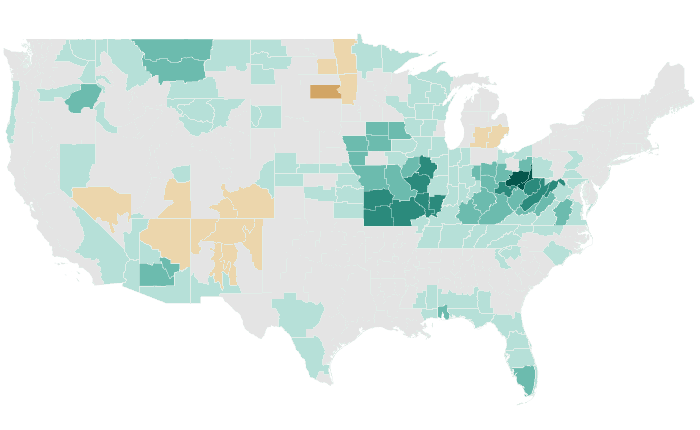
Precipitation: 50% accurate, opposite extreme 14% (NOAA CPC 95%, 0%)
Temperature

Outlooks
Probability of the favored tercile: 40, 50, 60, 70%+
Observed
Departure from normal: steps at ±0.5, 1, 2, 3°F
Precipitation


Outlooks
Probability of the favored tercile: 40, 50, 60, 70%+
Observed
Percent of normal: steps at 50, 70, 80, 90, 110, 120, 130, 150%
JAS 2019 issued June 2019
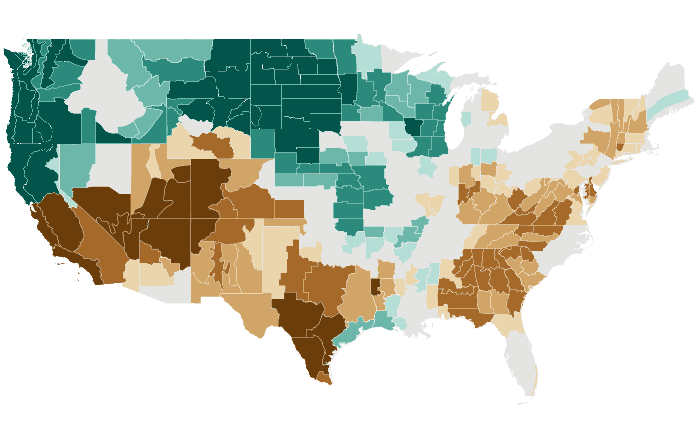
Temperature: 58% accurate, opposite extreme 9% (NOAA CPC 54%, 12%)
Precipitation: 46% accurate, opposite extreme 33% (NOAA CPC 67%, 15%)
Temperature
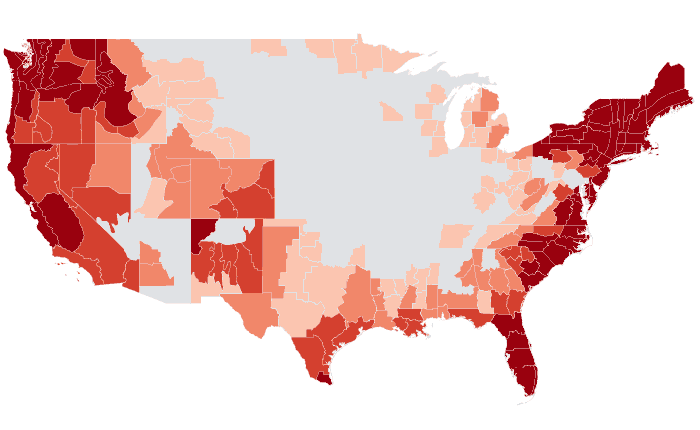
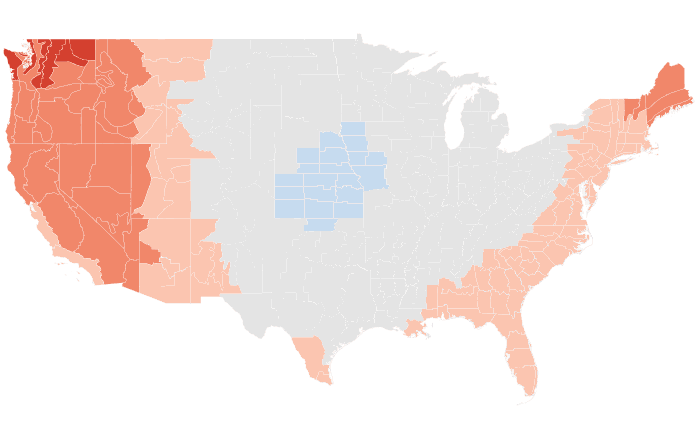

Outlooks
Probability of the favored tercile: 40, 50, 60, 70%+
Observed
Departure from normal: steps at ±0.5, 1, 2, 3°F
Precipitation
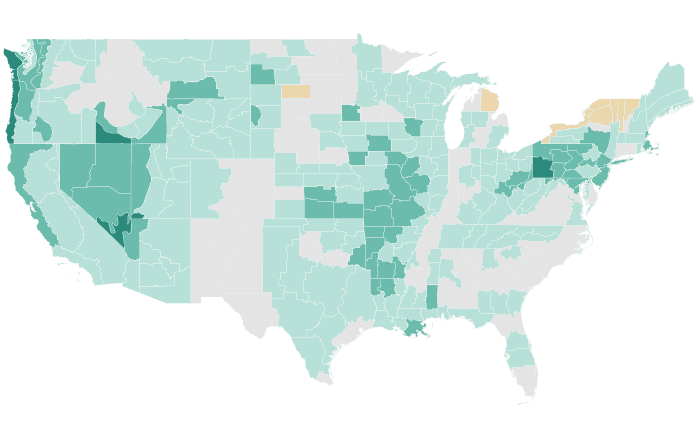
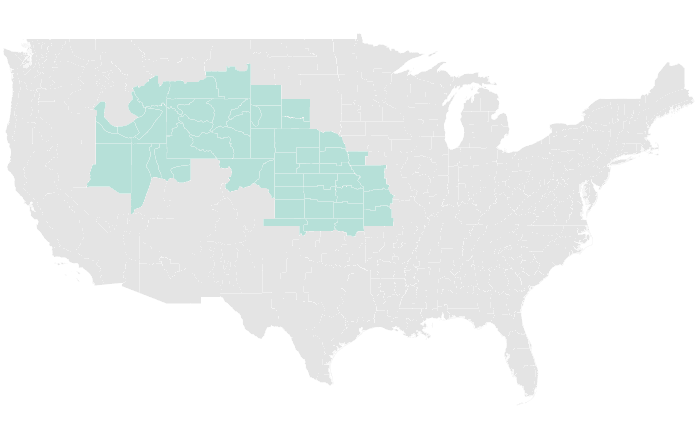
Outlooks
Probability of the favored tercile: 40, 50, 60, 70%+
Observed
Percent of normal: steps at 50, 70, 80, 90, 110, 120, 130, 150%
JJA 2019 issued May 2019
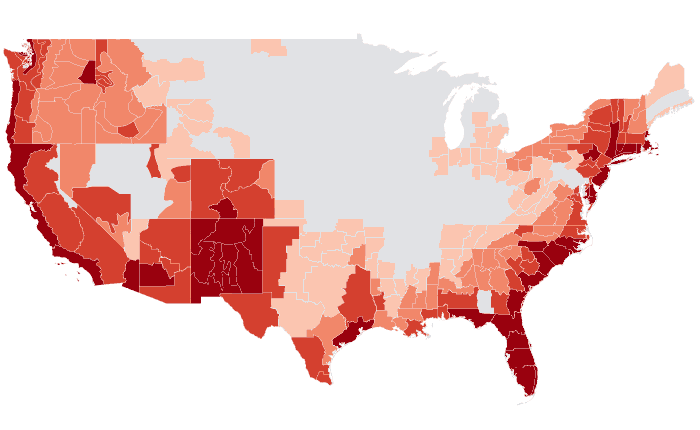
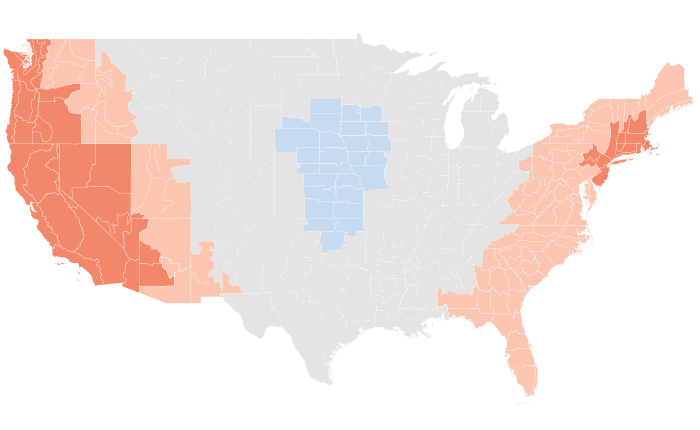
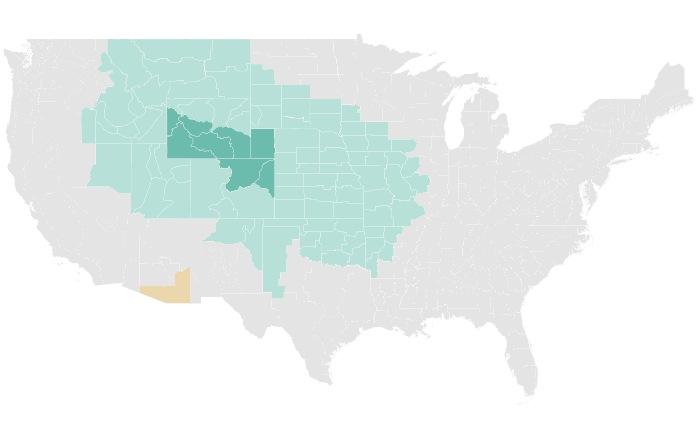
Temperature: 64% accurate, opposite extreme 2% (NOAA CPC 56%, 0%)
Precipitation: 40% accurate, opposite extreme 35% (NOAA CPC 40%, 45%)
Temperature

Outlooks
Probability of the favored tercile: 40, 50, 60, 70%+
Observed
Departure from normal: steps at ±0.5, 1, 2, 3°F
Precipitation


Outlooks
Probability of the favored tercile: 40, 50, 60, 70%+
Observed
Percent of normal: steps at 50, 70, 80, 90, 110, 120, 130, 150%
MJJ 2019 issued April 2019
Temperature: 36% accurate, opposite extreme 35% (NOAA CPC 54%, 22%)
Precipitation: 69% accurate, opposite extreme 8% (NOAA CPC 69%, 6%)
Temperature
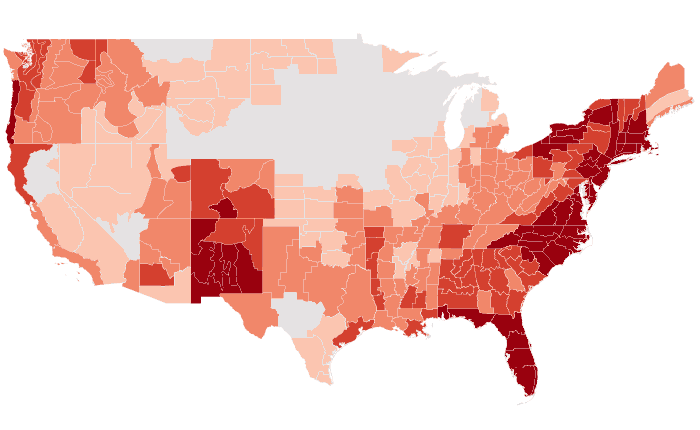
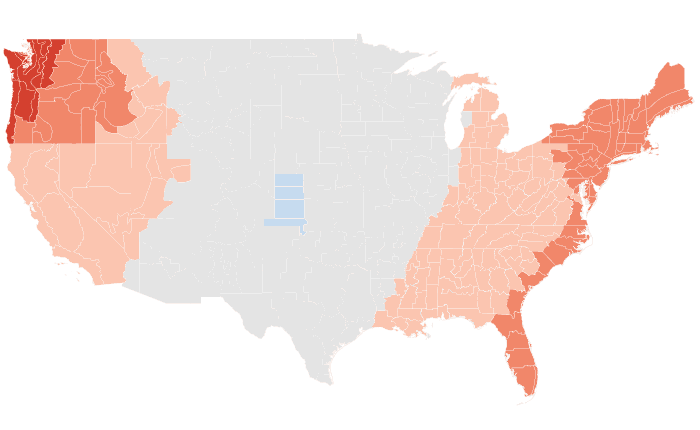

Outlooks
Probability of the favored tercile: 40, 50, 60, 70%+
Observed
Departure from normal: steps at ±0.5, 1, 2, 3°F
Precipitation

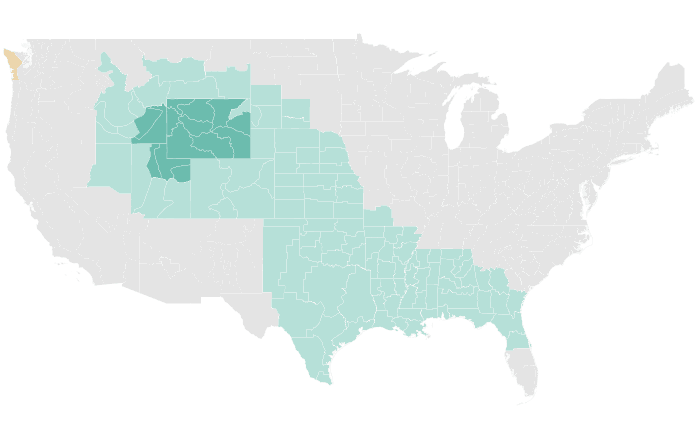
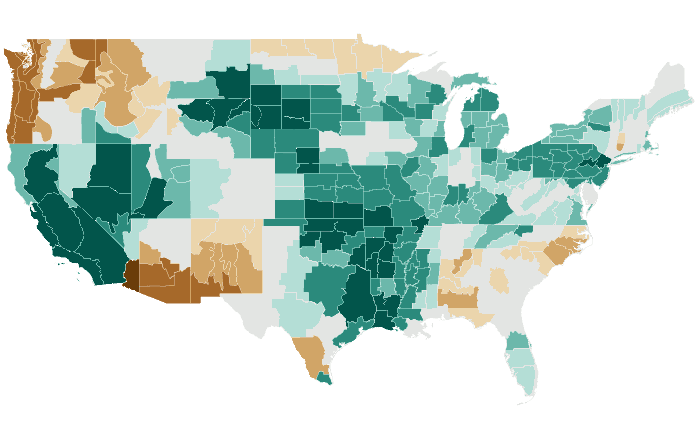
Outlooks
Probability of the favored tercile: 40, 50, 60, 70%+
Observed
Percent of normal: steps at 50, 70, 80, 90, 110, 120, 130, 150%
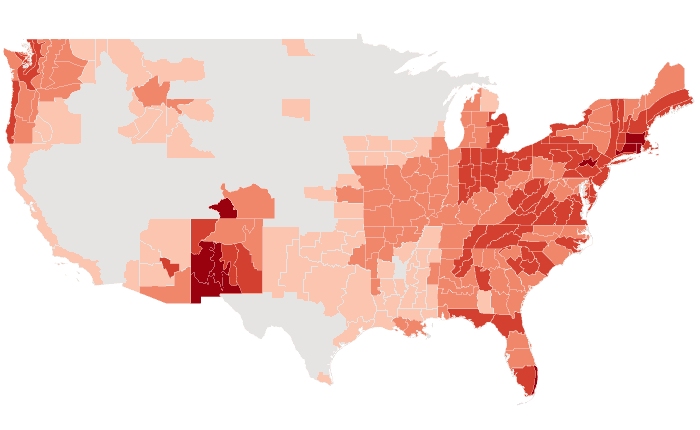
AMJ 2019 issued March 2019
Temperature: 42% accurate, opposite extreme 22% (NOAA CPC 74%, 7%)
Precipitation: 68% accurate, opposite extreme 2% (NOAA CPC 71%, 1%)
Temperature


Outlooks
Probability of the favored tercile: 40, 50, 60, 70%+
Observed
Departure from normal: steps at ±0.5, 1, 2, 3°F
Precipitation


Outlooks
Probability of the favored tercile: 40, 50, 60, 70%+
Observed
Percent of normal: steps at 50, 70, 80, 90, 110, 120, 130, 150%
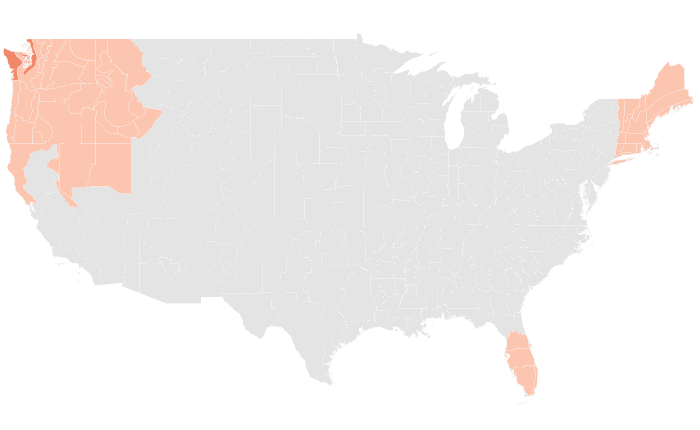
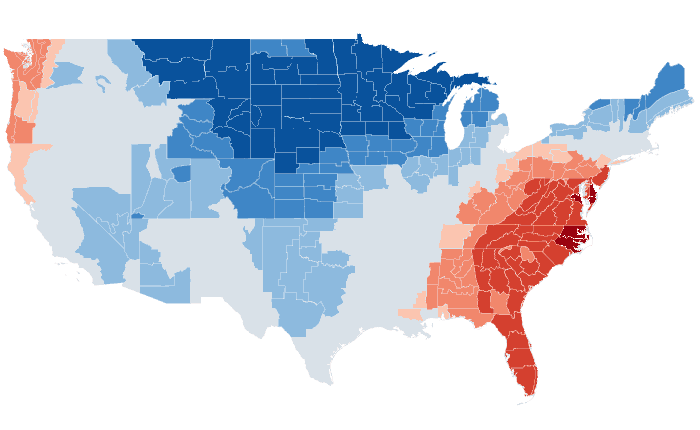
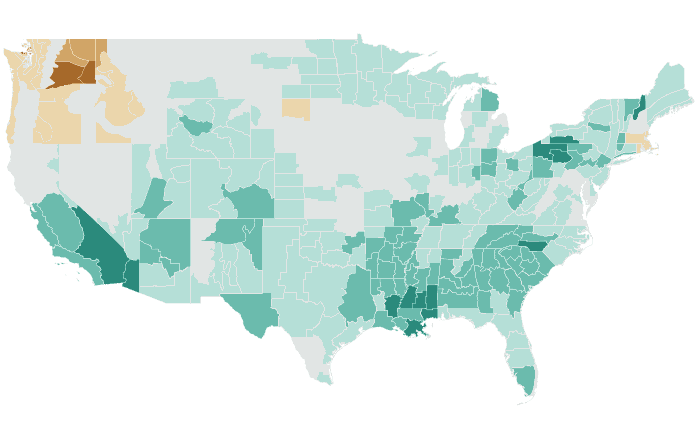
MAM 2019 issued February 2019
Temperature: 21% accurate, opposite extreme 40% (NOAA CPC 25%, 33%)
Precipitation: 58% accurate, opposite extreme 6% (NOAA CPC 41%, 16%)
Temperature

Outlooks
Probability of the favored tercile: 40, 50, 60, 70%+
Observed
Departure from normal: steps at ±0.5, 1, 2, 3°F
Precipitation

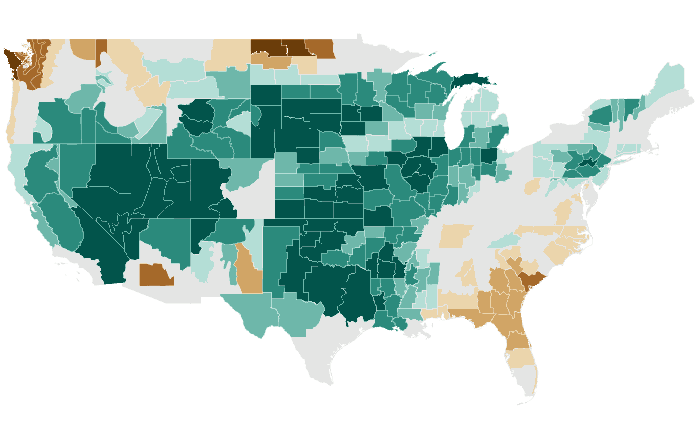
Outlooks
Probability of the favored tercile: 40, 50, 60, 70%+
Observed
Percent of normal: steps at 50, 70, 80, 90, 110, 120, 130, 150%
FMA 2019 issued January 2019
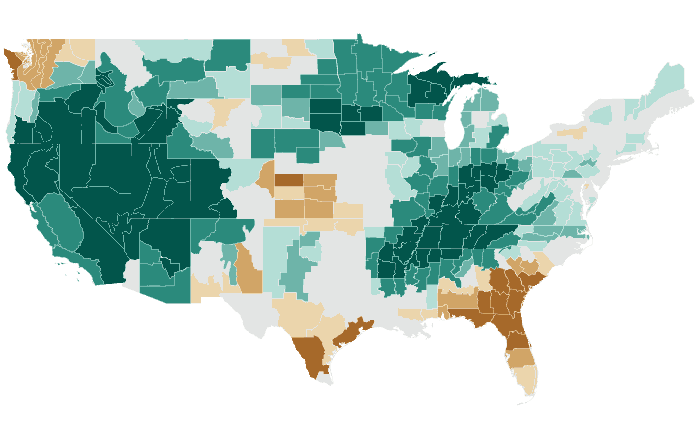
Temperature: 16% accurate, opposite extreme 57% (NOAA CPC 0%, 85%)
Precipitation: 53% accurate, opposite extreme 16% (NOAA CPC 17%, 61%)
Temperature
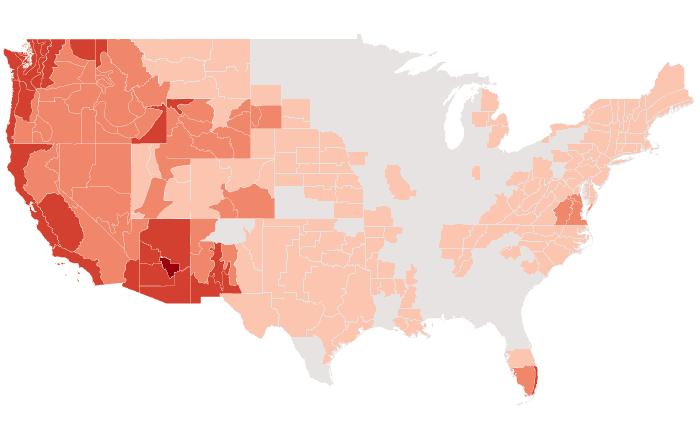

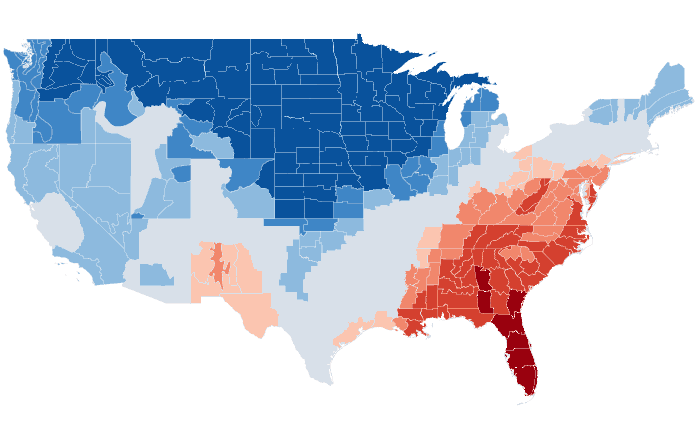
Outlooks
Probability of the favored tercile: 40, 50, 60, 70%+
Observed
Departure from normal: steps at ±0.5, 1, 2, 3°F
Precipitation

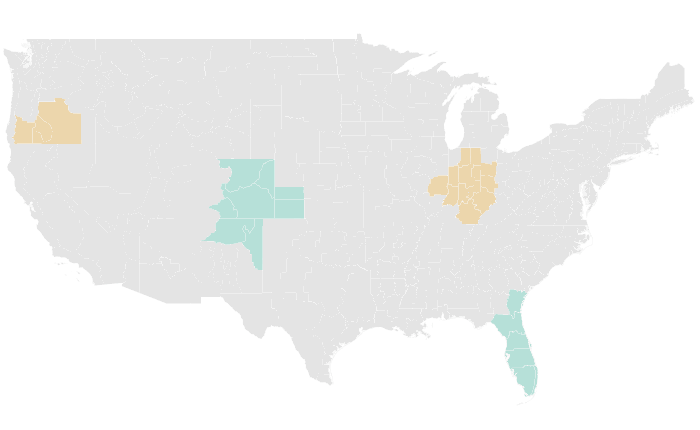
Outlooks
Probability of the favored tercile: 40, 50, 60, 70%+
Observed
Percent of normal: steps at 50, 70, 80, 90, 110, 120, 130, 150%
JFM 2019 issued December 2018
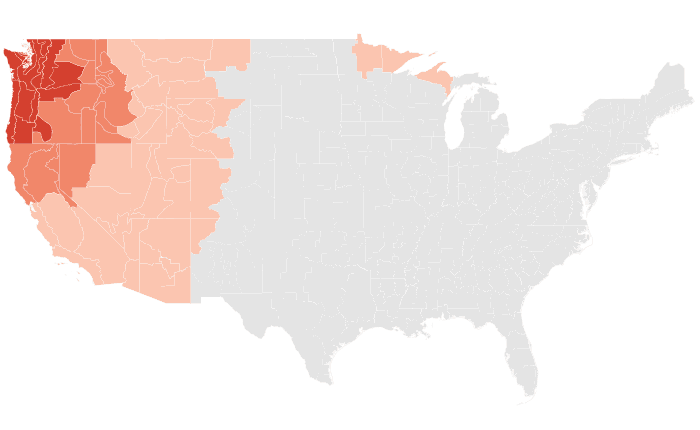
Temperature: 19% accurate, opposite extreme 50% (NOAA CPC 0%, 94%)
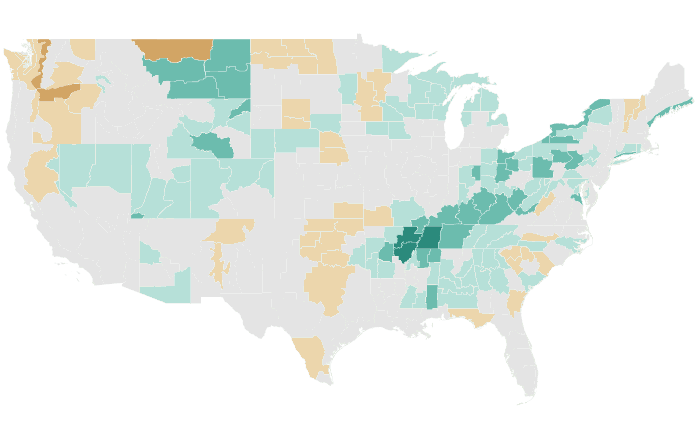
Precipitation: 60% accurate, opposite extreme 14% (NOAA CPC 12%, 70%)
Temperature


Outlooks
Probability of the favored tercile: 40, 50, 60, 70%+
Observed
Departure from normal: steps at ±0.5, 1, 2, 3°F
Precipitation


Outlooks
Probability of the favored tercile: 40, 50, 60, 70%+
Observed
Percent of normal: steps at 50, 70, 80, 90, 110, 120, 130, 150%
DJF 2018-19 issued November 2018
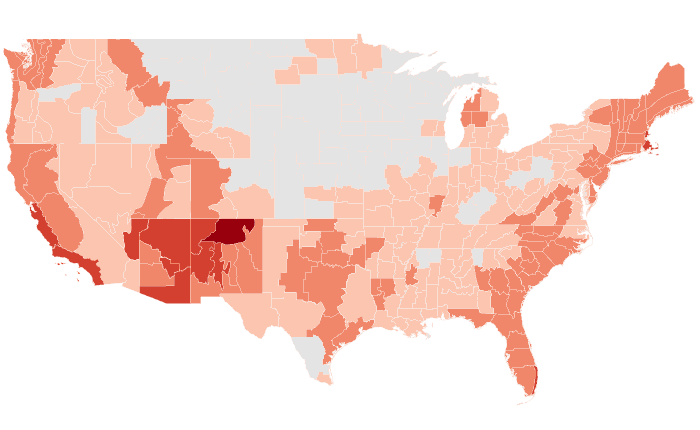
Temperature: 39% accurate, opposite extreme 26% (NOAA CPC 0%, 75%)
Precipitation: 40% accurate, opposite extreme 39% (NOAA CPC 51%, 18%)
Temperature


Outlooks
Probability of the favored tercile: 40, 50, 60, 70%+
Observed
Departure from normal: steps at ±0.5, 1, 2, 3°F
Precipitation

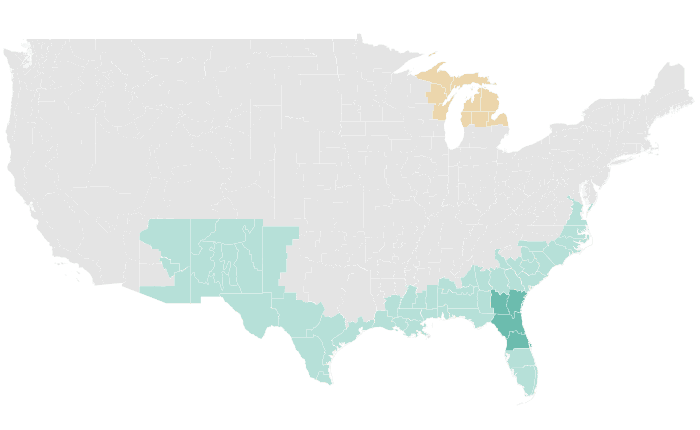
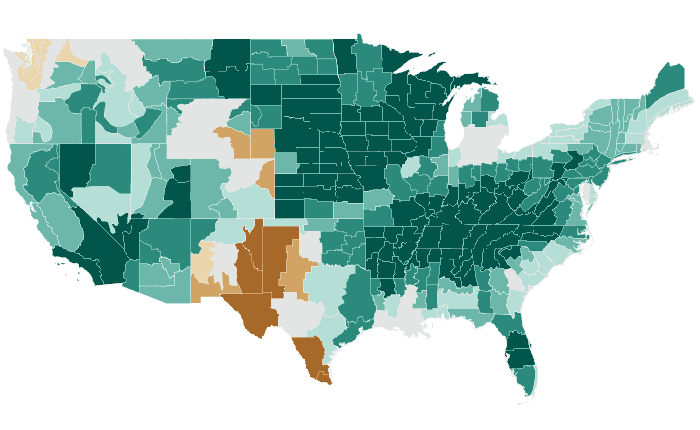
Outlooks
Probability of the favored tercile: 40, 50, 60, 70%+
Observed
Percent of normal: steps at 50, 70, 80, 90, 110, 120, 130, 150%
NDJ 2018-19 issued October 2018
Temperature: 28% accurate, opposite extreme 14% (NOAA CPC 32%, 11%)
Precipitation: 44% accurate, opposite extreme 20% (NOAA CPC 56%, 0%)
Temperature
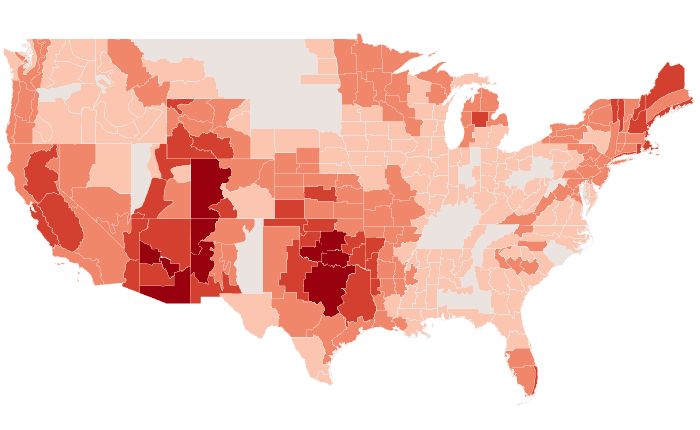
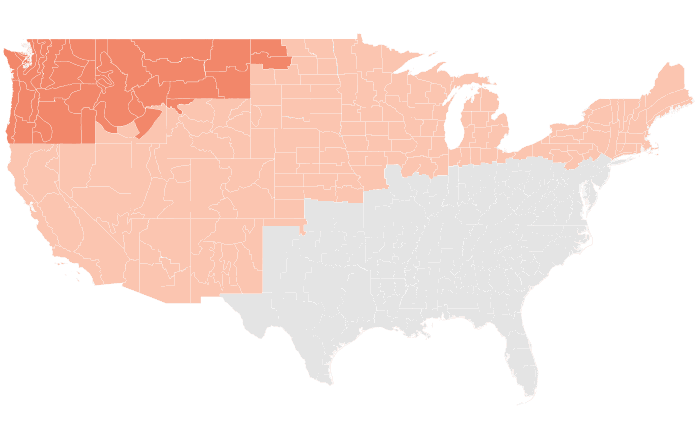

Outlooks
Probability of the favored tercile: 40, 50, 60, 70%+
Observed
Departure from normal: steps at ±0.5, 1, 2, 3°F
Precipitation
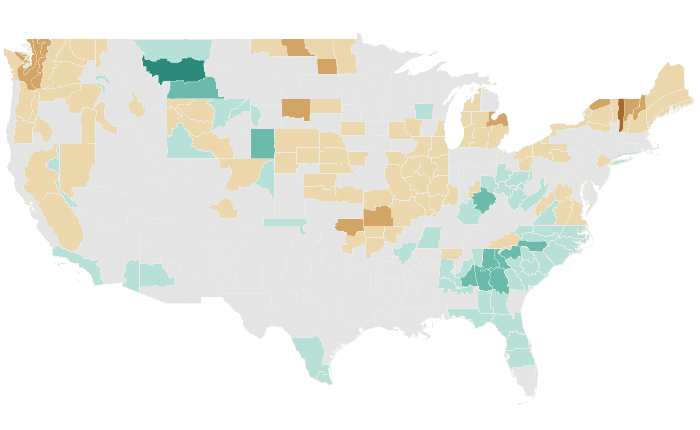


Outlooks
Probability of the favored tercile: 40, 50, 60, 70%+
Observed
Percent of normal: steps at 50, 70, 80, 90, 110, 120, 130, 150%
OND 2018 issued September 2018
Temperature: 18% accurate, opposite extreme 38% (NOAA CPC 13%, 37%)
Precipitation: 28% accurate, opposite extreme 30% (NOAA CPC 74%, 2%)
Temperature


Outlooks
Probability of the favored tercile: 40, 50, 60, 70%+
Observed
Departure from normal: steps at ±0.5, 1, 2, 3°F
Precipitation


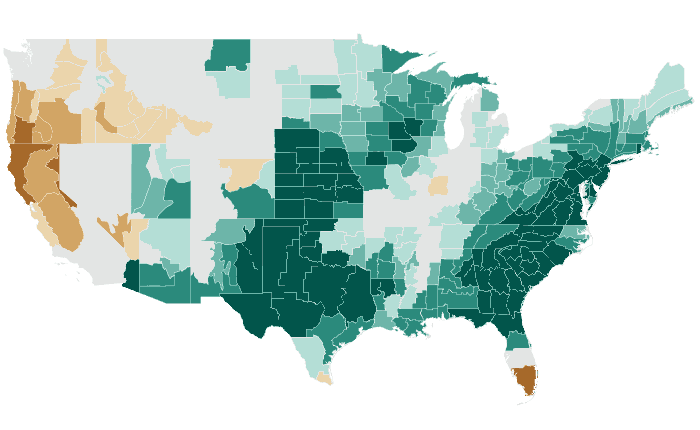
Outlooks
Probability of the favored tercile: 40, 50, 60, 70%+
Observed
Percent of normal: steps at 50, 70, 80, 90, 110, 120, 130, 150%
SON 2018 issued August 2018
Temperature: 28% accurate, opposite extreme 31% (NOAA CPC 15%, 38%)
Precipitation: 62% accurate, opposite extreme 10% (NOAA CPC 27%, 12%)
Temperature
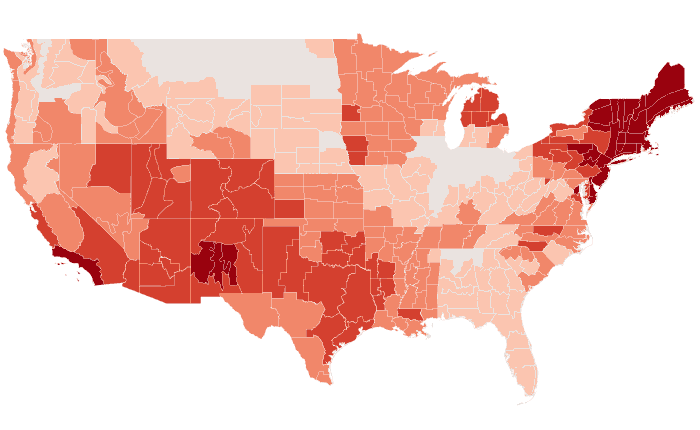

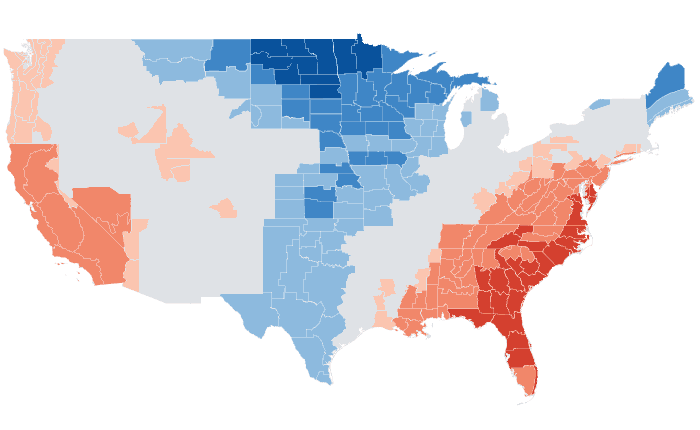
Outlooks
Probability of the favored tercile: 40, 50, 60, 70%+
Observed
Departure from normal: steps at ±0.5, 1, 2, 3°F
Precipitation
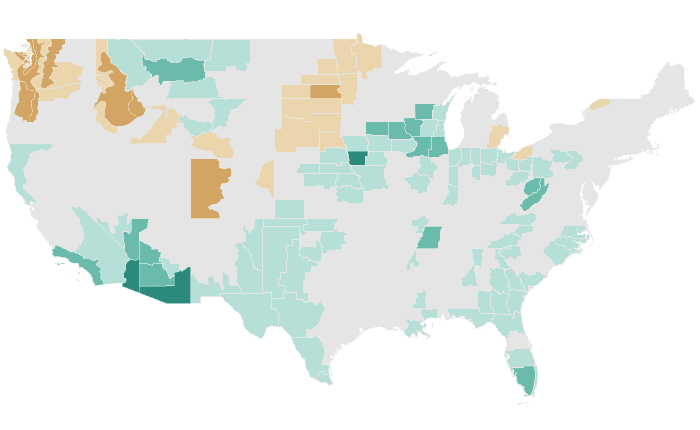


Outlooks
Probability of the favored tercile: 40, 50, 60, 70%+
Observed
Percent of normal: steps at 50, 70, 80, 90, 110, 120, 130, 150%
ASO 2018 issued July 2018
Temperature: 60% accurate, opposite extreme 12% (NOAA CPC 65%, 6%)
Precipitation: 44% accurate, opposite extreme 21% (NOAA CPC 38%, 32%)
Temperature

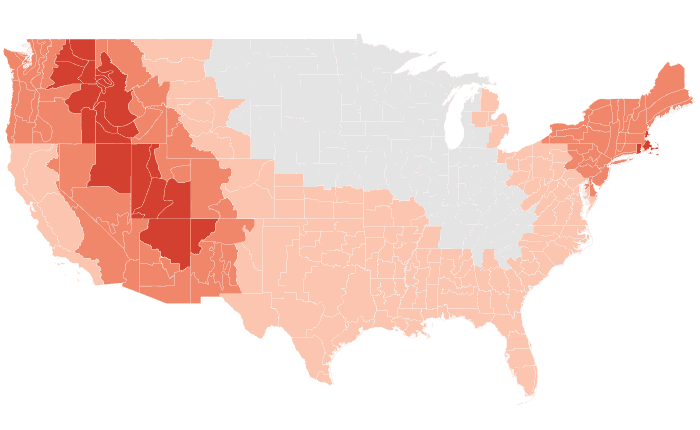

Outlooks
Probability of the favored tercile: 40, 50, 60, 70%+
Observed
Departure from normal: steps at ±0.5, 1, 2, 3°F
Precipitation


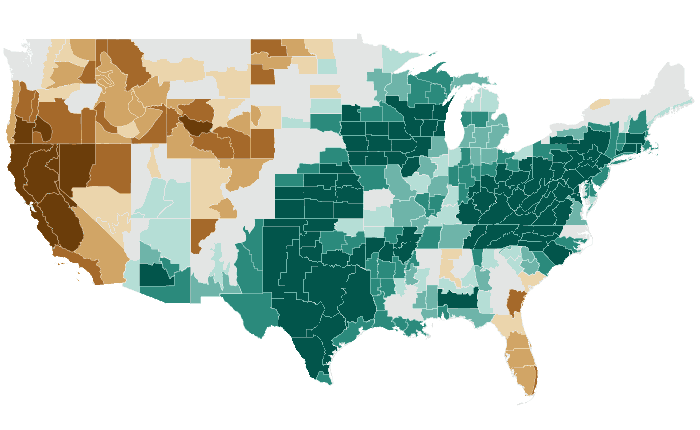
Outlooks
Probability of the favored tercile: 40, 50, 60, 70%+
Observed
Percent of normal: steps at 50, 70, 80, 90, 110, 120, 130, 150%
JAS 2018 issued June 2018
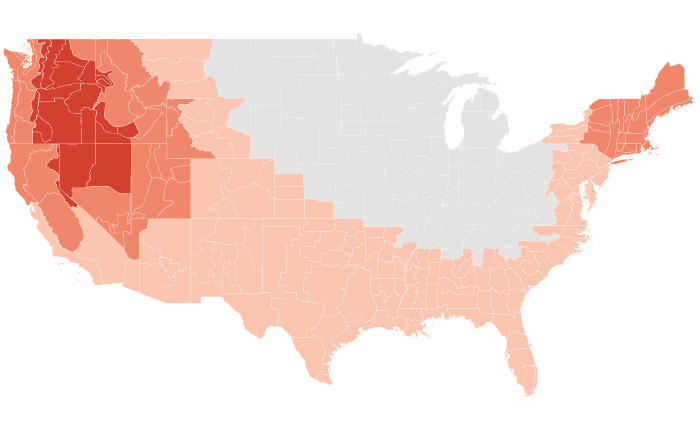
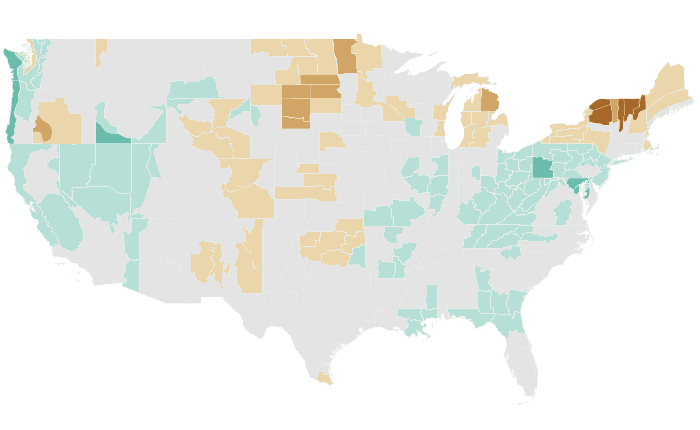
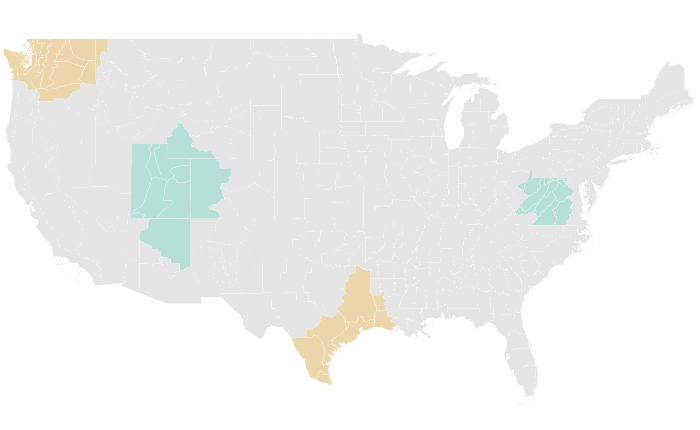
Temperature: 71% accurate, opposite extreme 6% (NOAA CPC 90%, 3%)
Precipitation: 41% accurate, opposite extreme 28% (NOAA CPC 30%, 55%)
Temperature
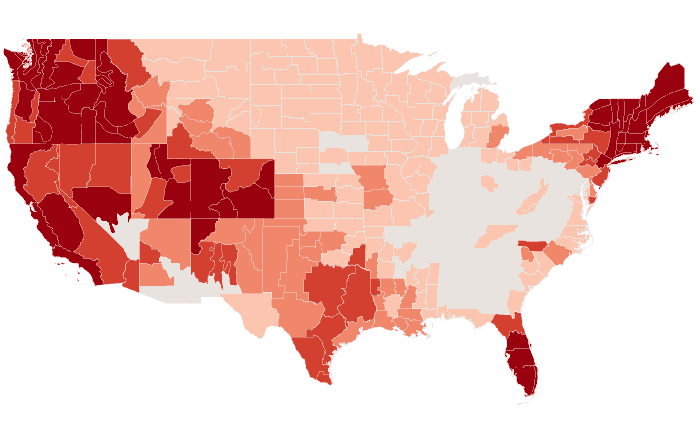

Outlooks
Probability of the favored tercile: 40, 50, 60, 70%+
Observed
Departure from normal: steps at ±0.5, 1, 2, 3°F
Precipitation

Outlooks
Probability of the favored tercile: 40, 50, 60, 70%+
Observed
Percent of normal: steps at 50, 70, 80, 90, 110, 120, 130, 150%
JJA 2018 issued May 2018
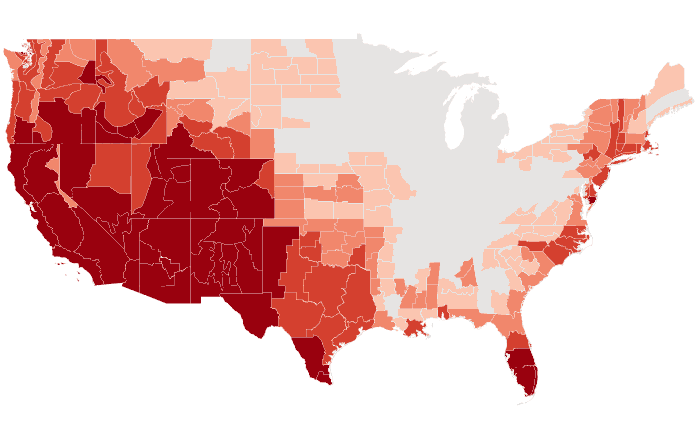
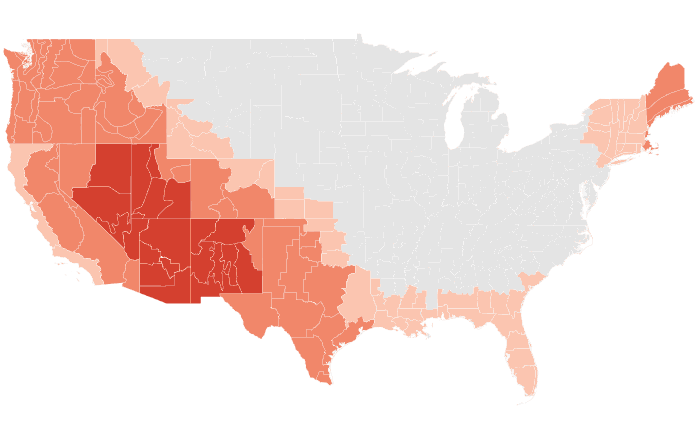
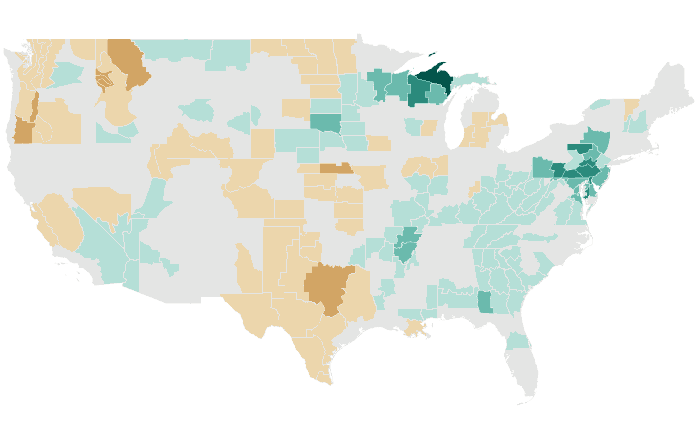
Temperature: 87% accurate, opposite extreme 0% (NOAA CPC 98%, 0%)
Precipitation: 66% accurate, opposite extreme 9% (NOAA CPC 77%, 12%)
Temperature

Outlooks
Probability of the favored tercile: 40, 50, 60, 70%+
Observed
Departure from normal: steps at ±0.5, 1, 2, 3°F
Precipitation


Outlooks
Probability of the favored tercile: 40, 50, 60, 70%+
Observed
Percent of normal: steps at 50, 70, 80, 90, 110, 120, 130, 150%
MJJ 2018 issued April 2018
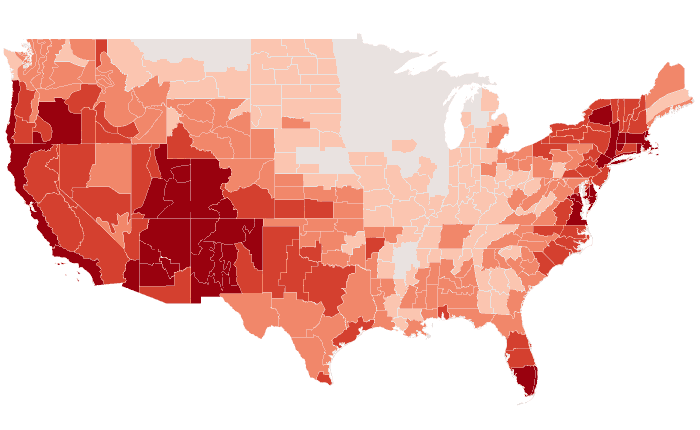
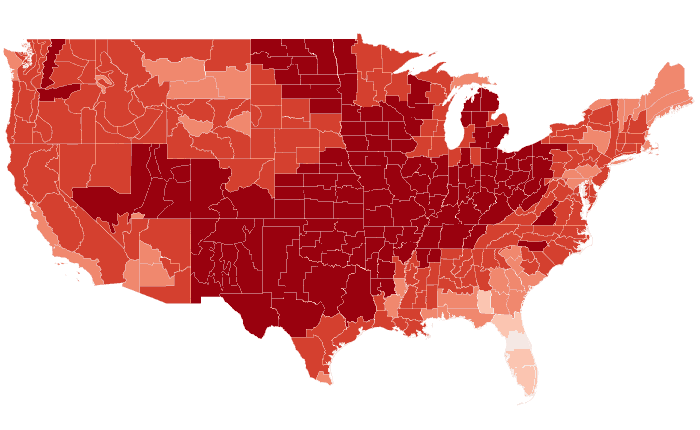
Temperature: 99% accurate, opposite extreme 0% (NOAA CPC 100%, 0%)
Precipitation: 52% accurate, opposite extreme 19% (NOAA CPC 51%, 12%)
Temperature

Outlooks
Probability of the favored tercile: 40, 50, 60, 70%+
Observed
Departure from normal: steps at ±0.5, 1, 2, 3°F
Precipitation

Outlooks
Probability of the favored tercile: 40, 50, 60, 70%+
Observed
Percent of normal: steps at 50, 70, 80, 90, 110, 120, 130, 150%
AMJ 2018 issued March 2018
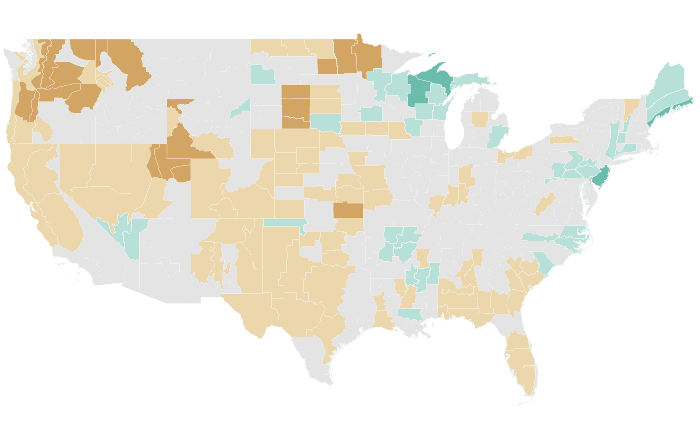
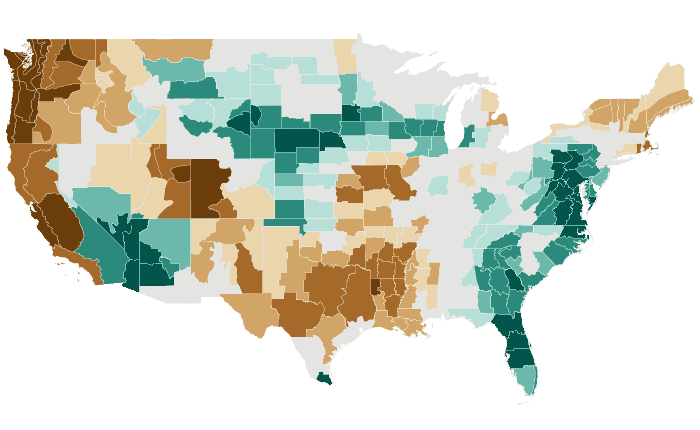
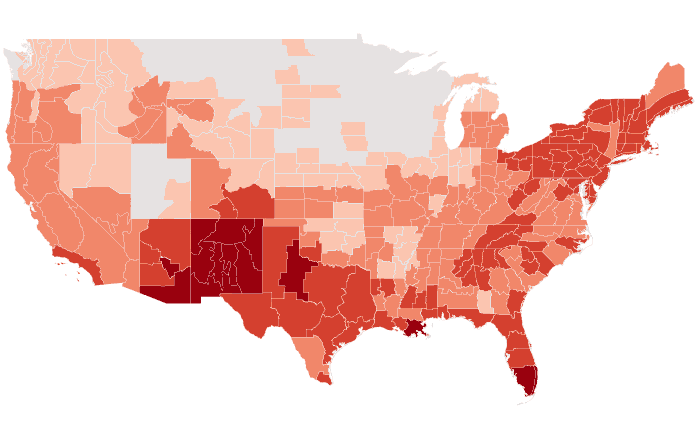
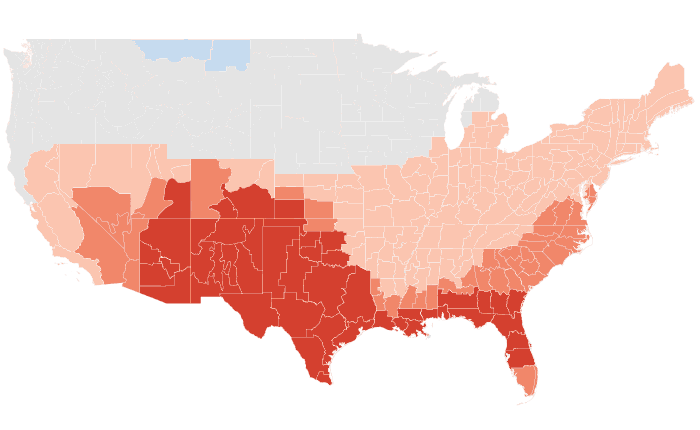
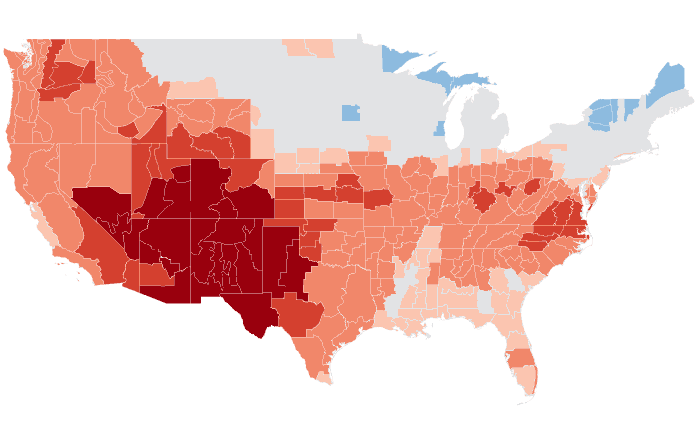
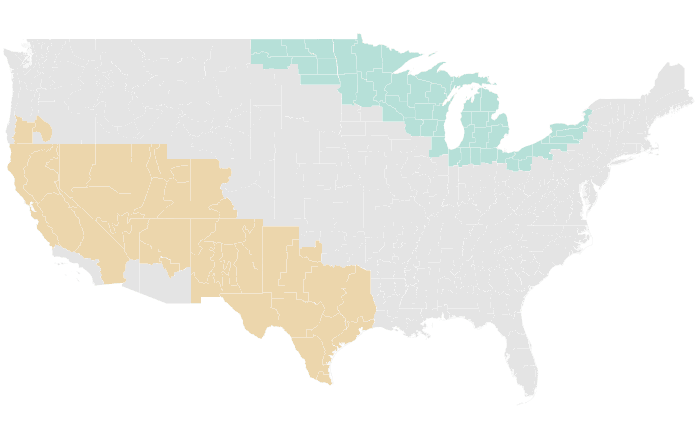
Temperature: 80% accurate, opposite extreme 2% (NOAA CPC 84%, 3%)
Precipitation: 50% accurate, opposite extreme 16% (NOAA CPC 59%, 9%)
Temperature
Outlooks
Probability of the favored tercile: 40, 50, 60, 70%+
Observed
Departure from normal: steps at ±0.5, 1, 2, 3°F
Precipitation


Outlooks
Probability of the favored tercile: 40, 50, 60, 70%+
Observed
Percent of normal: steps at 50, 70, 80, 90, 110, 120, 130, 150%
MAM 2018 issued February 2018
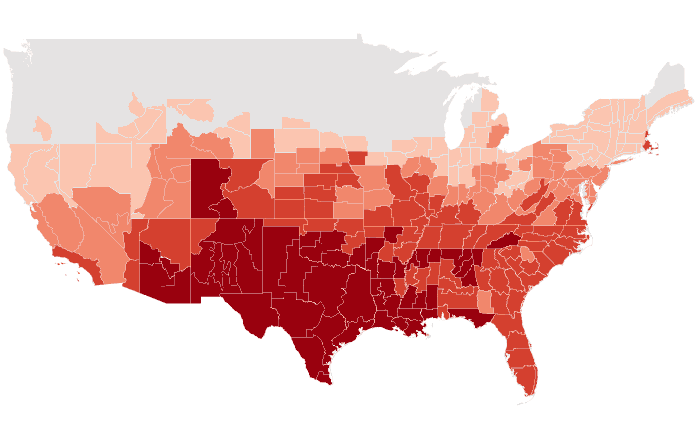
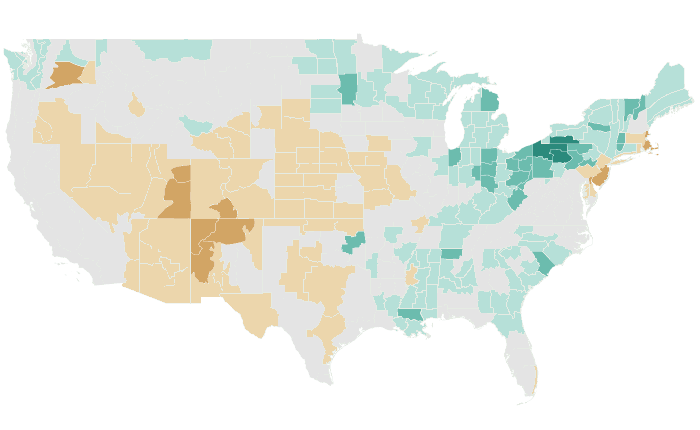
Temperature: 39% accurate, opposite extreme 6% (NOAA CPC 66%, 9%)
Precipitation: 52% accurate, opposite extreme 18% (NOAA CPC 56%, 15%)
Temperature


Outlooks
Probability of the favored tercile: 40, 50, 60, 70%+
Observed
Departure from normal: steps at ±0.5, 1, 2, 3°F
Precipitation


Outlooks
Probability of the favored tercile: 40, 50, 60, 70%+
Observed
Percent of normal: steps at 50, 70, 80, 90, 110, 120, 130, 150%
FMA 2018 issued January 2018
Temperature: 50% accurate, opposite extreme 23% (NOAA CPC 88%, 0%)
Precipitation: 68% accurate, opposite extreme 6% (NOAA CPC 82%, 0%)
Temperature
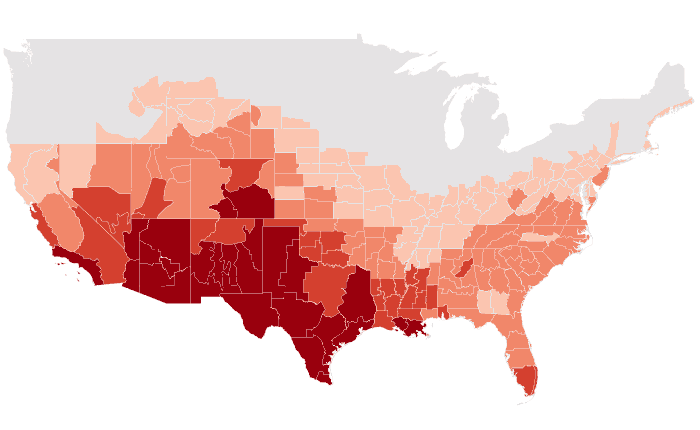
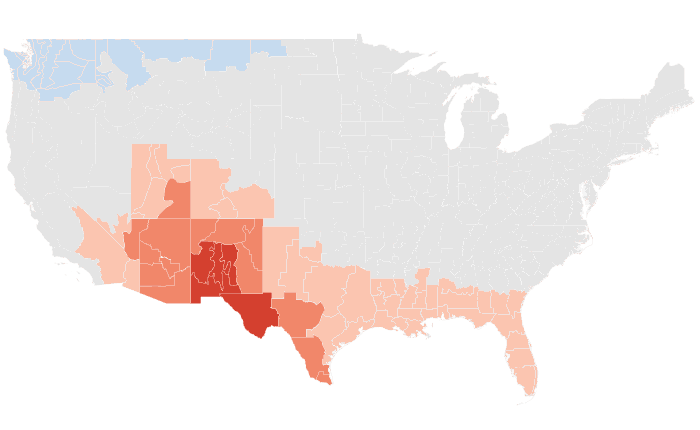

Outlooks
Probability of the favored tercile: 40, 50, 60, 70%+
Observed
Departure from normal: steps at ±0.5, 1, 2, 3°F
Precipitation


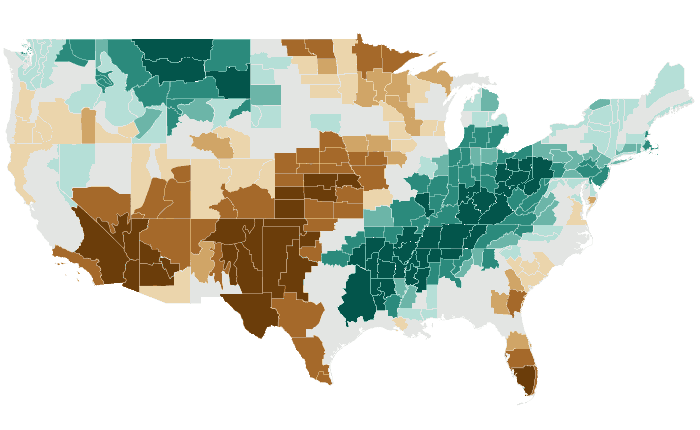
Outlooks
Probability of the favored tercile: 40, 50, 60, 70%+
Observed
Percent of normal: steps at 50, 70, 80, 90, 110, 120, 130, 150%
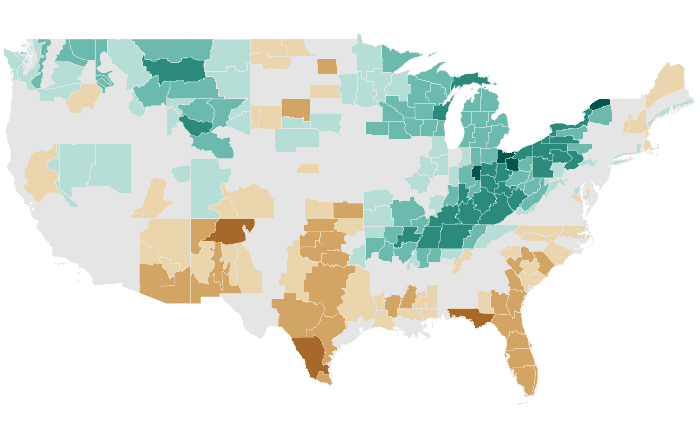
JFM 2018 issued December 2017
Temperature: 50% accurate, opposite extreme 8% (NOAA CPC 78%, 0%)
Precipitation: 60% accurate, opposite extreme 10% (NOAA CPC 78%, 0%)
Temperature

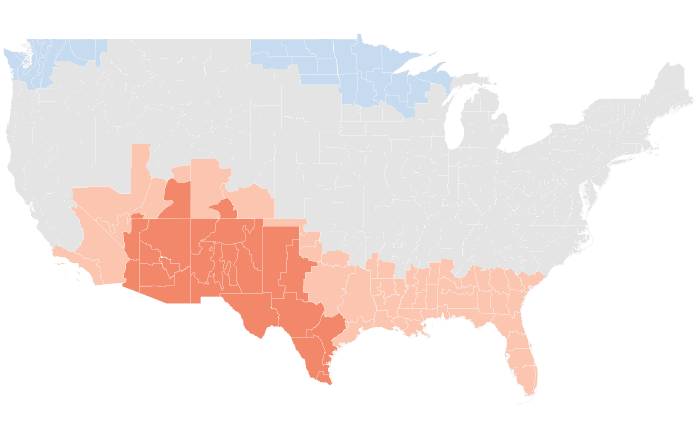

Outlooks
Probability of the favored tercile: 40, 50, 60, 70%+
Observed
Departure from normal: steps at ±0.5, 1, 2, 3°F
Precipitation


Outlooks
Probability of the favored tercile: 40, 50, 60, 70%+
Observed
Percent of normal: steps at 50, 70, 80, 90, 110, 120, 130, 150%
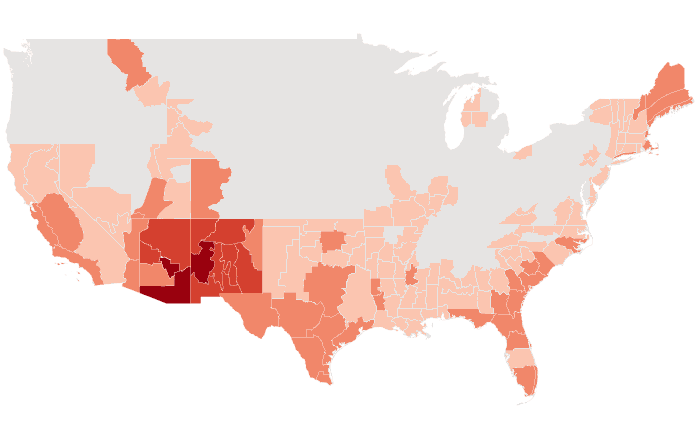
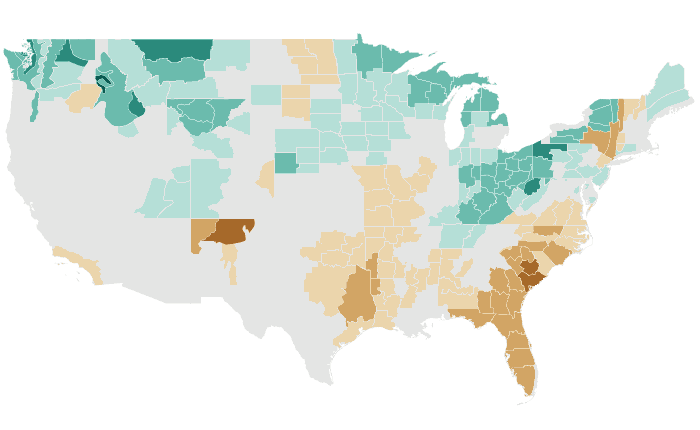
DJF 2017-18 issued November 2017
Temperature: 57% accurate, opposite extreme 2% (NOAA CPC 63%, 5%)
Precipitation: 44% accurate, opposite extreme 15% (NOAA CPC 58%, 4%)
Temperature


Outlooks
Probability of the favored tercile: 40, 50, 60, 70%+
Observed
Departure from normal: steps at ±0.5, 1, 2, 3°F
Precipitation


Outlooks
Probability of the favored tercile: 40, 50, 60, 70%+
Observed
Percent of normal: steps at 50, 70, 80, 90, 110, 120, 130, 150%
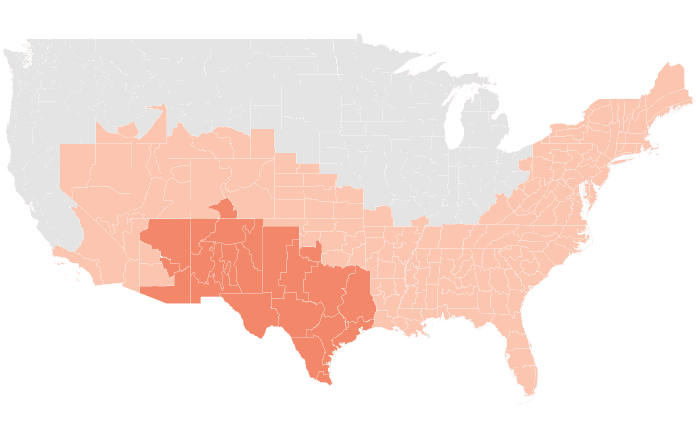
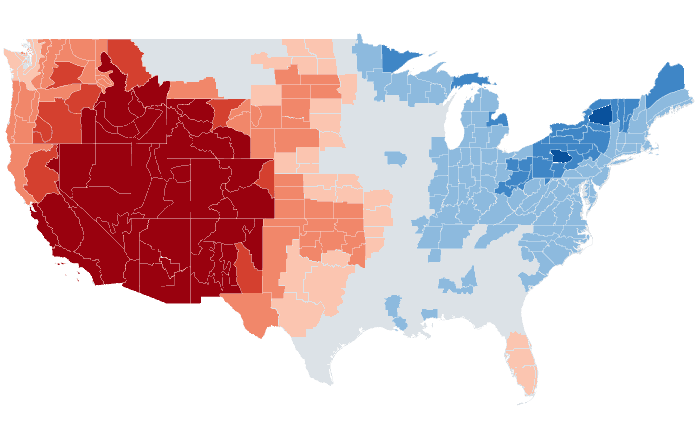
NDJ 2017-18 issued October 2017
Temperature: 47% accurate, opposite extreme 20% (NOAA CPC 53%, 25%)
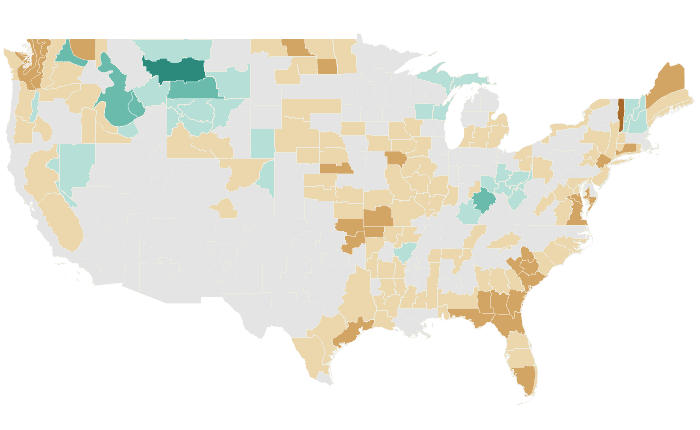
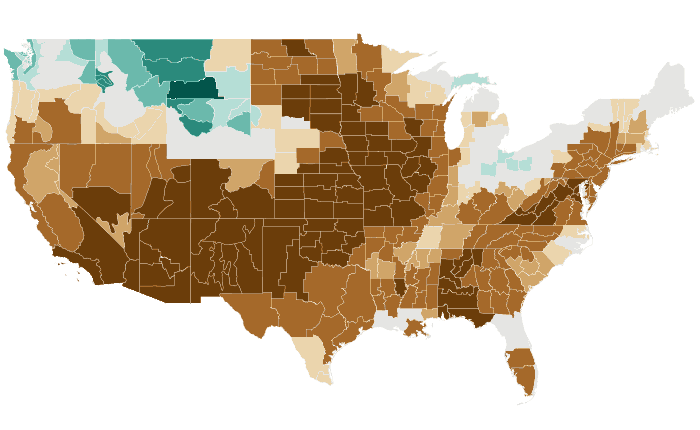
Precipitation: 53% accurate, opposite extreme 7% (NOAA CPC 75%, 0%)
Temperature

Outlooks
Probability of the favored tercile: 40, 50, 60, 70%+
Observed
Departure from normal: steps at ±0.5, 1, 2, 3°F
Precipitation

Outlooks
Probability of the favored tercile: 40, 50, 60, 70%+
Observed
Percent of normal: steps at 50, 70, 80, 90, 110, 120, 130, 150%
OND 2017 issued September 2017
Temperature: 68% accurate, opposite extreme 0% (NOAA CPC 78%, 0%)
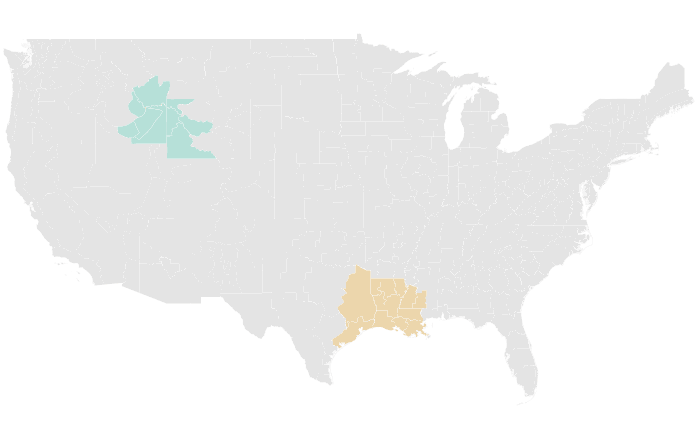
Precipitation: 56% accurate, opposite extreme 11% (NOAA CPC 57%, 17%)
Temperature


Outlooks
Probability of the favored tercile: 40, 50, 60, 70%+
Observed
Departure from normal: steps at ±0.5, 1, 2, 3°F
Precipitation


Outlooks
Probability of the favored tercile: 40, 50, 60, 70%+
Observed
Percent of normal: steps at 50, 70, 80, 90, 110, 120, 130, 150%
SON 2017 issued August 2017
Temperature: 85% accurate, opposite extreme 0% (NOAA CPC 76%, 0%)
Precipitation: 38% accurate, opposite extreme 26% (NOAA CPC 0%, 100%)
Temperature
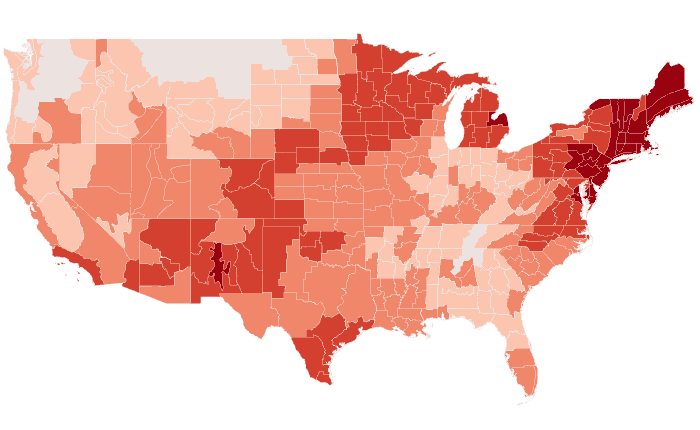

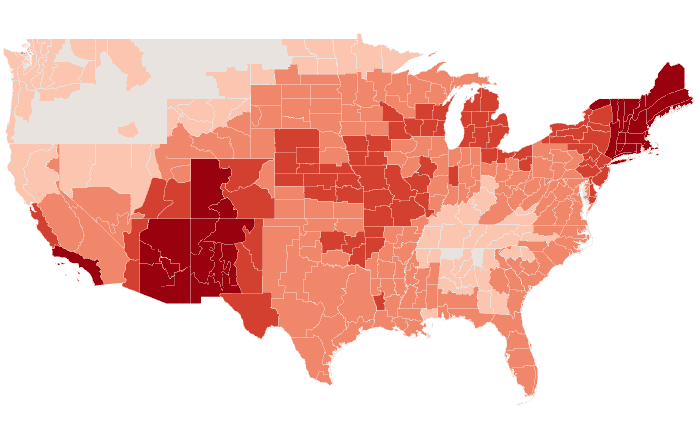
Outlooks
Probability of the favored tercile: 40, 50, 60, 70%+
Observed
Departure from normal: steps at ±0.5, 1, 2, 3°F
Precipitation


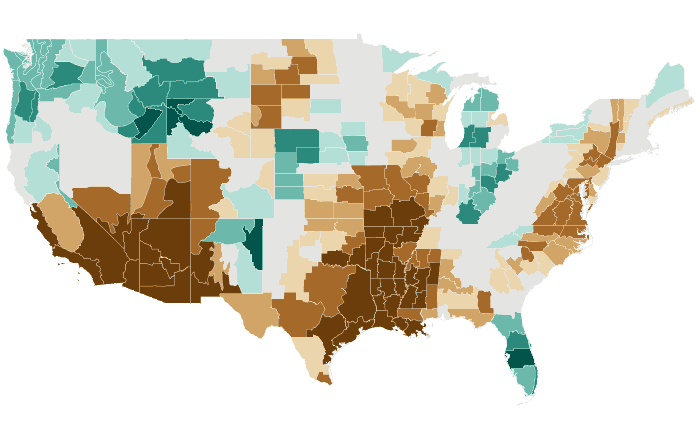
Outlooks
Probability of the favored tercile: 40, 50, 60, 70%+
Observed
Percent of normal: steps at 50, 70, 80, 90, 110, 120, 130, 150%
ASO 2017 issued July 2017
Temperature: 50% accurate, opposite extreme 6% (NOAA CPC 56%, 7%)
Precipitation: 35% accurate, opposite extreme 27% (NOAA CPC 23%, 41%)
Temperature
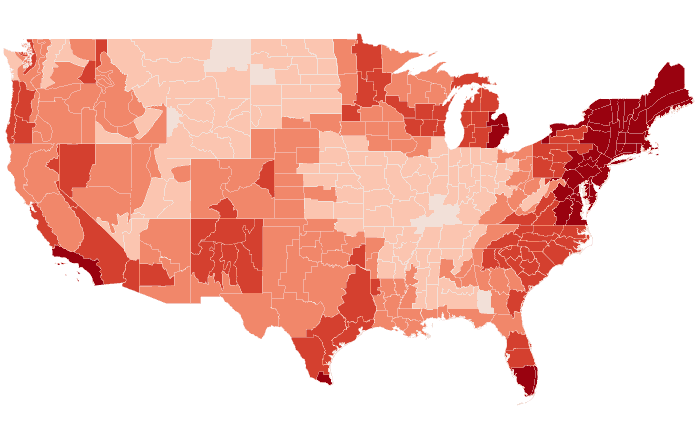


Outlooks
Probability of the favored tercile: 40, 50, 60, 70%+
Observed
Departure from normal: steps at ±0.5, 1, 2, 3°F
Precipitation


Outlooks
Probability of the favored tercile: 40, 50, 60, 70%+
Observed
Percent of normal: steps at 50, 70, 80, 90, 110, 120, 130, 150%
JAS 2017 issued June 2017
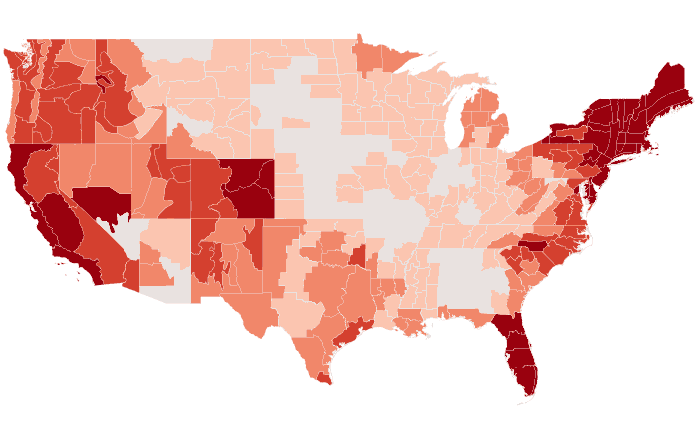
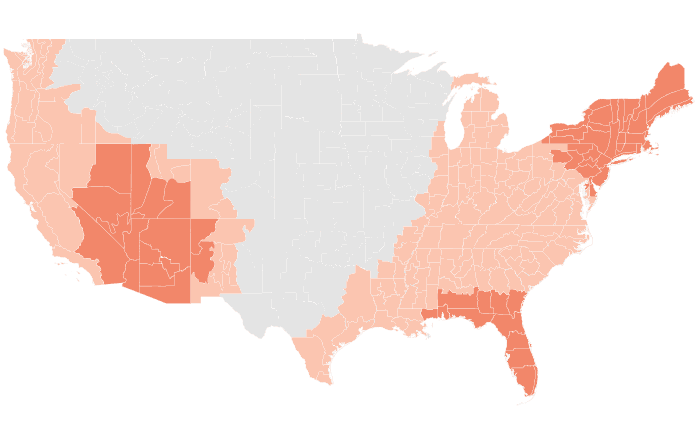
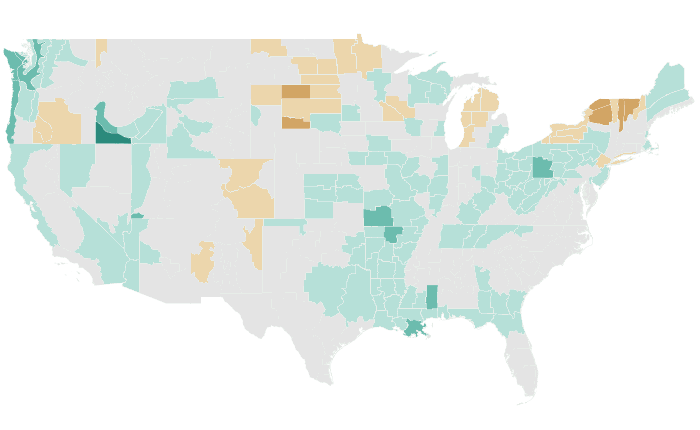
Temperature: 52% accurate, opposite extreme 2% (NOAA CPC 53%, 1%)
Precipitation: 47% accurate, opposite extreme 21% (NOAA CPC 8%, 40%)
Temperature

Outlooks
Probability of the favored tercile: 40, 50, 60, 70%+
Observed
Departure from normal: steps at ±0.5, 1, 2, 3°F
Precipitation


Outlooks
Probability of the favored tercile: 40, 50, 60, 70%+
Observed
Percent of normal: steps at 50, 70, 80, 90, 110, 120, 130, 150%
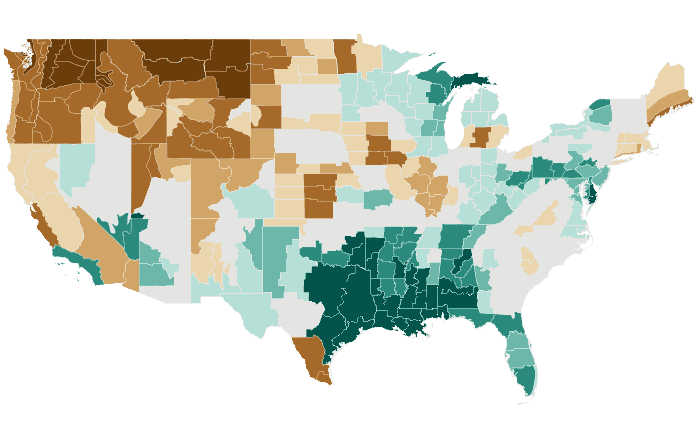
JJA 2017 issued May 2017
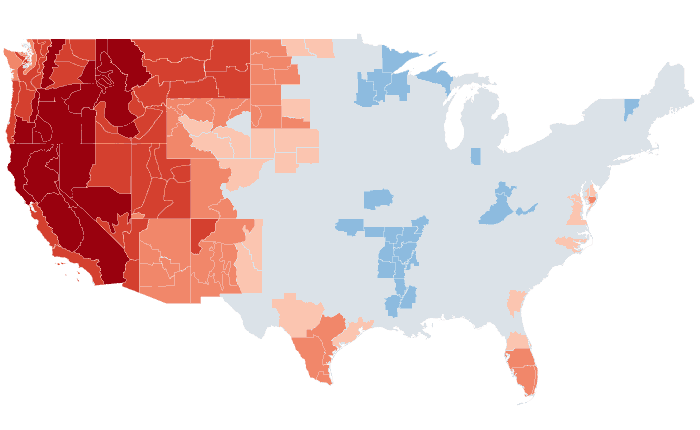
Temperature: 51% accurate, opposite extreme 14% (NOAA CPC 52%, 16%)
Precipitation: 40% accurate, opposite extreme 28% (NOAA CPC 0%, 77%)
Temperature


Outlooks
Probability of the favored tercile: 40, 50, 60, 70%+
Observed
Departure from normal: steps at ±0.5, 1, 2, 3°F
Precipitation


Outlooks
Probability of the favored tercile: 40, 50, 60, 70%+
Observed
Percent of normal: steps at 50, 70, 80, 90, 110, 120, 130, 150%
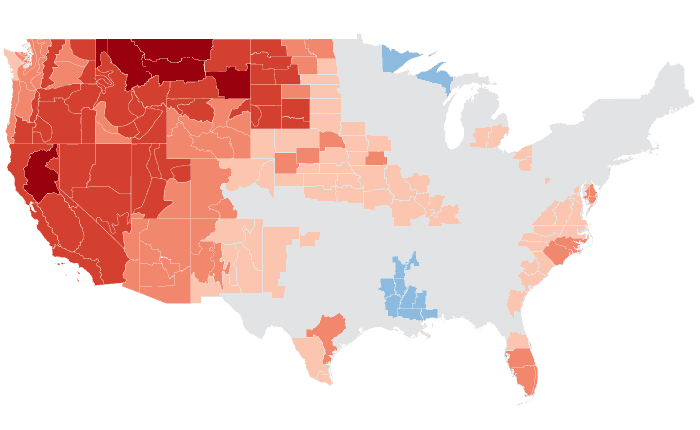
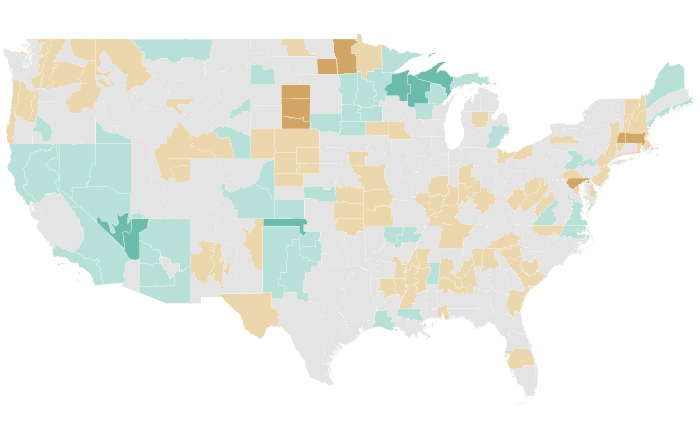
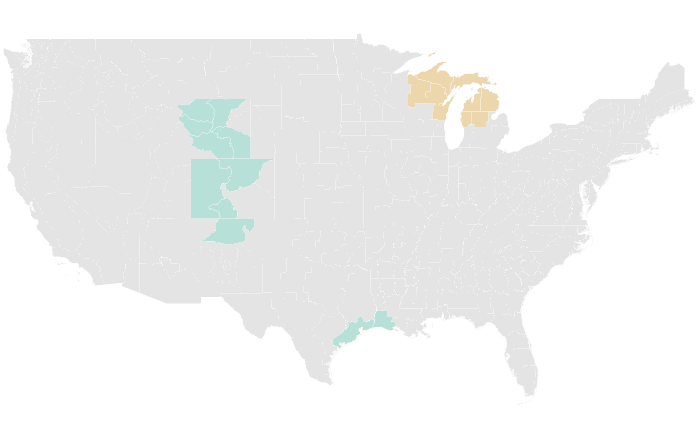
MJJ 2017 issued April 2017
Temperature: 60% accurate, opposite extreme 8% (NOAA CPC 51%, 9%)
Precipitation: 38% accurate, opposite extreme 32% (NOAA CPC 7%, 51%)
Temperature


Outlooks
Probability of the favored tercile: 40, 50, 60, 70%+
Observed
Departure from normal: steps at ±0.5, 1, 2, 3°F
Precipitation

Outlooks
Probability of the favored tercile: 40, 50, 60, 70%+
Observed
Percent of normal: steps at 50, 70, 80, 90, 110, 120, 130, 150%
AMJ 2017 issued March 2017
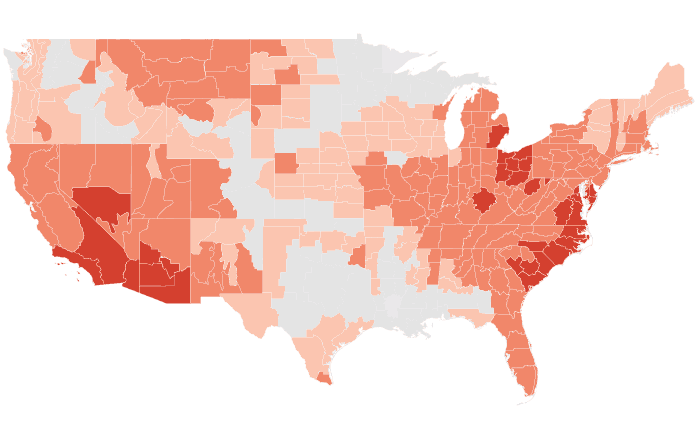
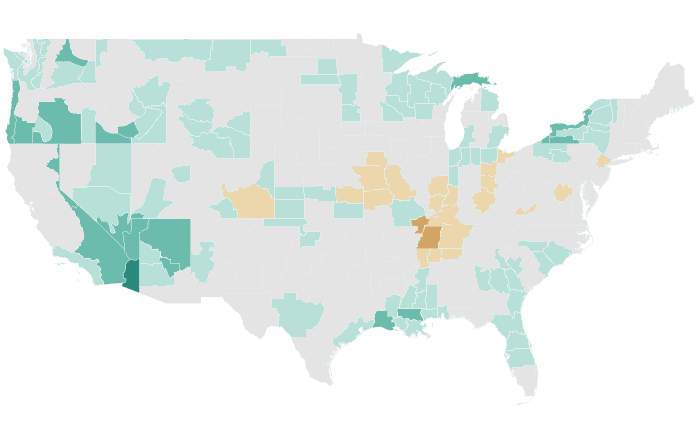
Temperature: 63% accurate, opposite extreme 2% (NOAA CPC 57%, 0%)
Precipitation: 44% accurate, opposite extreme 16% (NOAA CPC 8%, 78%)
Temperature


Outlooks
Probability of the favored tercile: 40, 50, 60, 70%+
Observed
Departure from normal: steps at ±0.5, 1, 2, 3°F
Precipitation


Outlooks
Probability of the favored tercile: 40, 50, 60, 70%+
Observed
Percent of normal: steps at 50, 70, 80, 90, 110, 120, 130, 150%
MAM 2017 issued February 2017
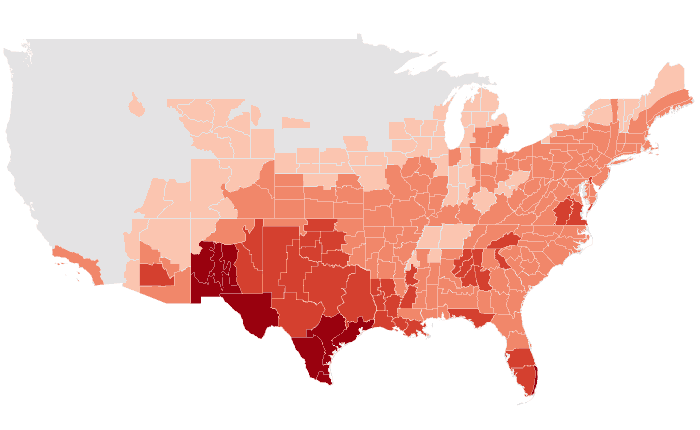
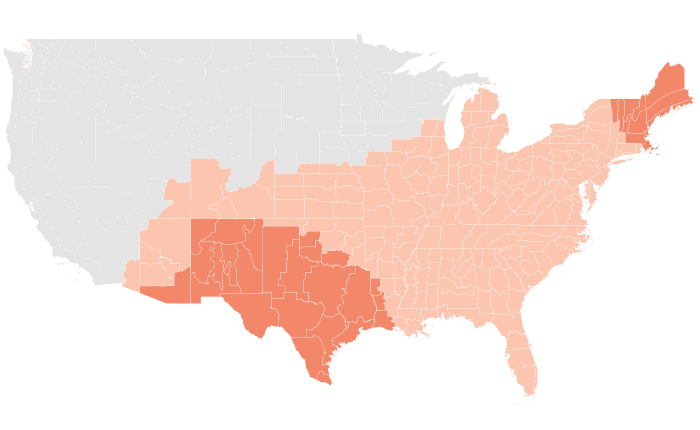
Temperature: 85% accurate, opposite extreme 2% (NOAA CPC 88%, 0%)
Precipitation: 46% accurate, opposite extreme 27% (NOAA CPC 45%, 46%)
Temperature

Outlooks
Probability of the favored tercile: 40, 50, 60, 70%+
Observed
Departure from normal: steps at ±0.5, 1, 2, 3°F
Precipitation


Outlooks
Probability of the favored tercile: 40, 50, 60, 70%+
Observed
Percent of normal: steps at 50, 70, 80, 90, 110, 120, 130, 150%
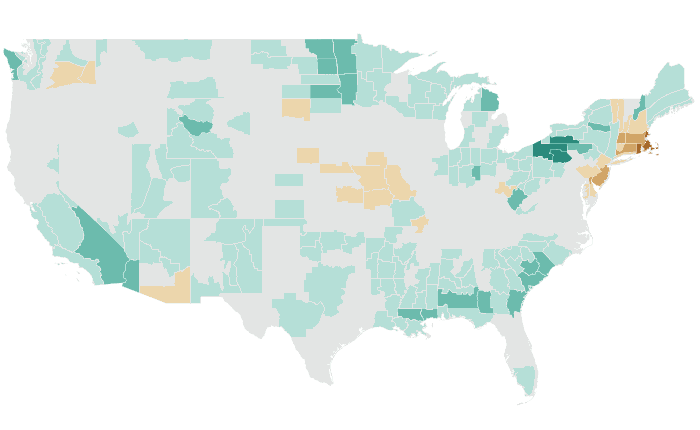
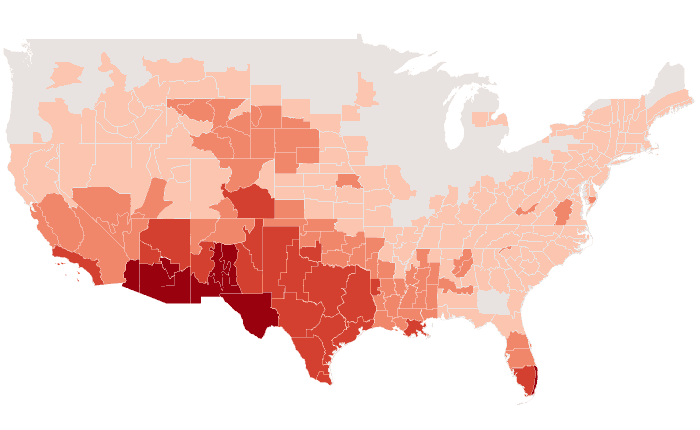
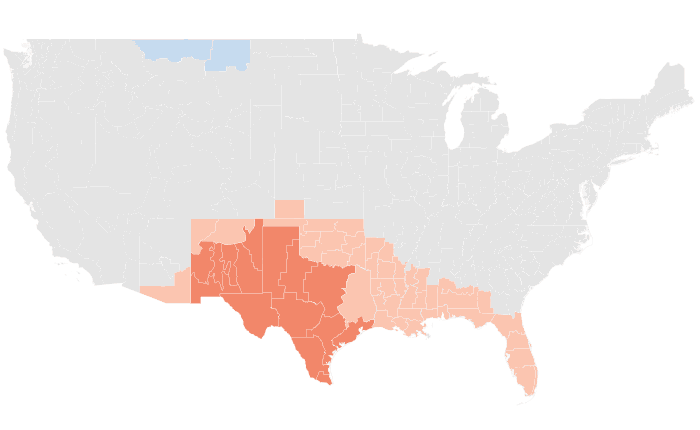
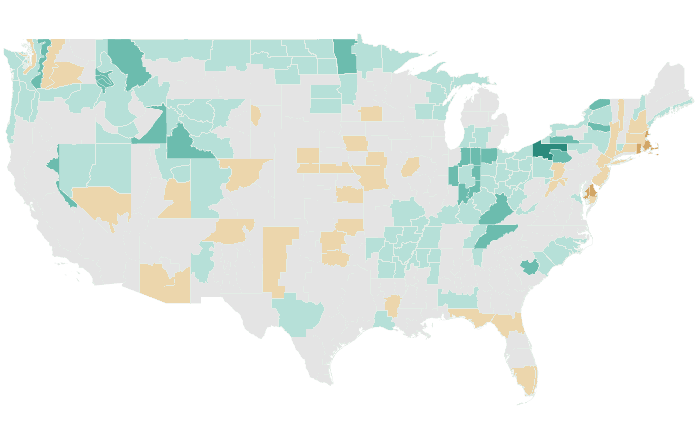
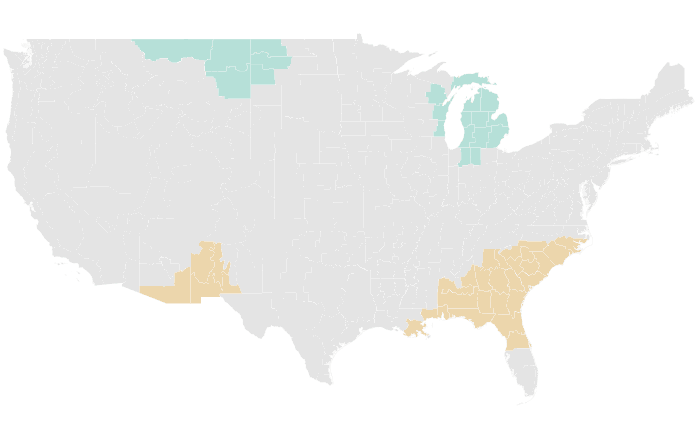
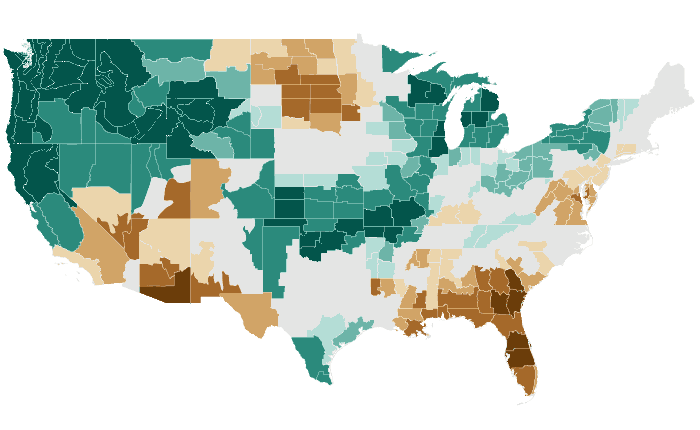
FMA 2017 issued January 2017
Temperature: 94% accurate, opposite extreme 0% (NOAA CPC 93%, 3%)
Precipitation: 56% accurate, opposite extreme 18% (NOAA CPC 74%, 10%)
Temperature

Outlooks
Probability of the favored tercile: 40, 50, 60, 70%+
Observed
Departure from normal: steps at ±0.5, 1, 2, 3°F
Precipitation
Outlooks
Probability of the favored tercile: 40, 50, 60, 70%+
Observed
Percent of normal: steps at 50, 70, 80, 90, 110, 120, 130, 150%
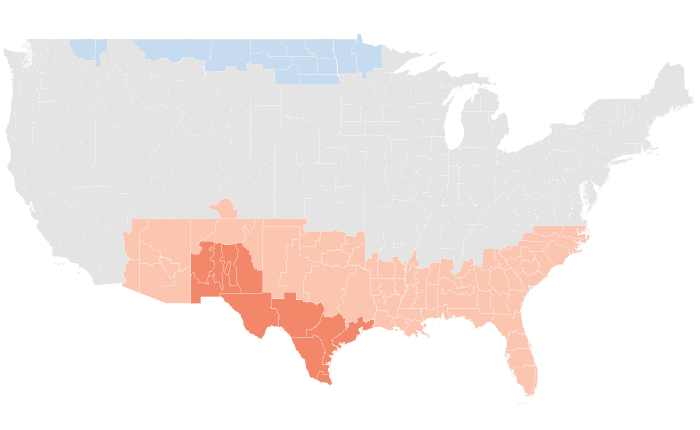
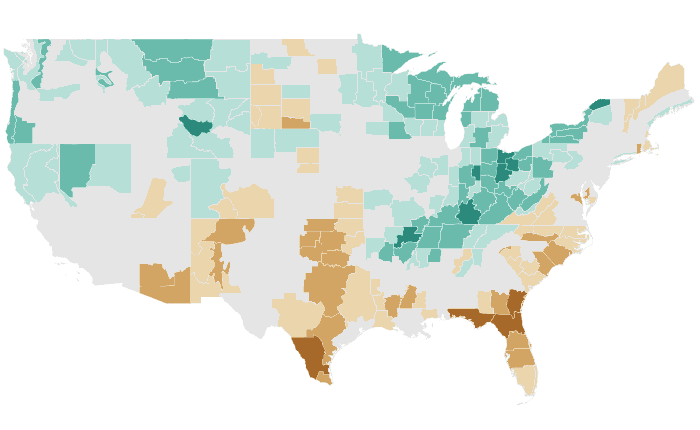
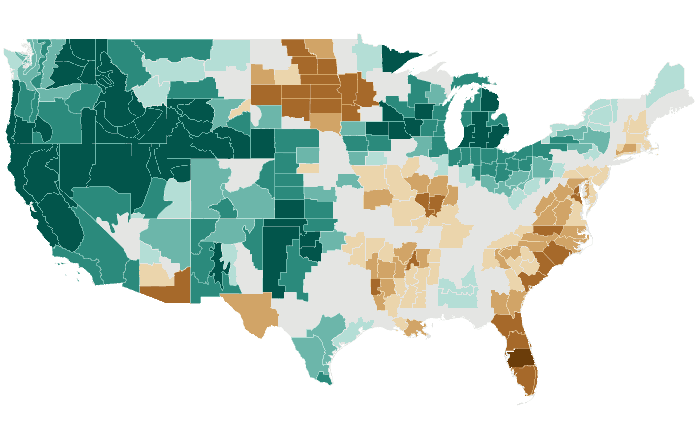
JFM 2017 issued December 2016
Temperature: 64% accurate, opposite extreme 19% (NOAA CPC 87%, 5%)
Precipitation: 50% accurate, opposite extreme 15% (NOAA CPC 43%, 19%)
Temperature


Outlooks
Probability of the favored tercile: 40, 50, 60, 70%+
Observed
Departure from normal: steps at ±0.5, 1, 2, 3°F
Precipitation

Outlooks
Probability of the favored tercile: 40, 50, 60, 70%+
Observed
Percent of normal: steps at 50, 70, 80, 90, 110, 120, 130, 150%
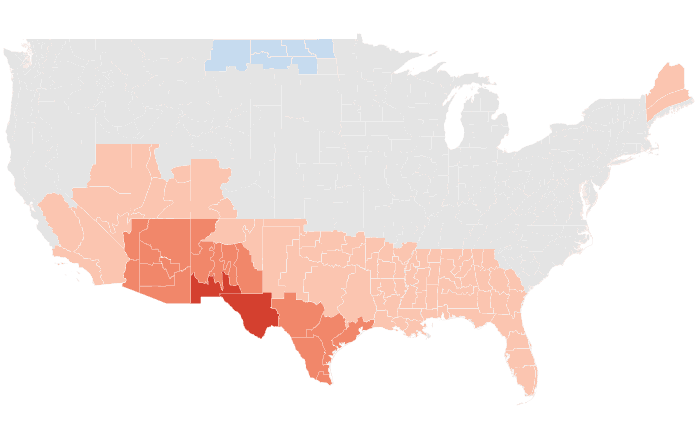
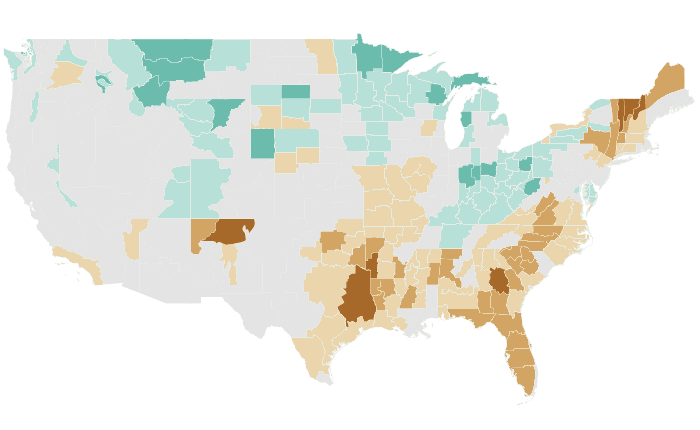
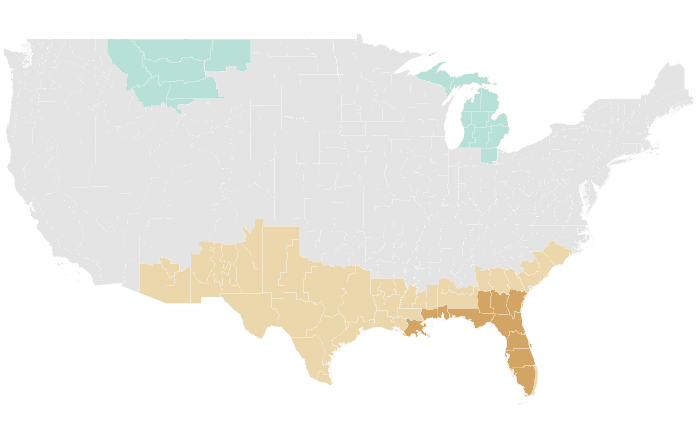
DJF 2016-17 issued November 2016
Temperature: 61% accurate, opposite extreme 12% (NOAA CPC 79%, 1%)
Precipitation: 50% accurate, opposite extreme 16% (NOAA CPC 33%, 41%)
Temperature


Outlooks
Probability of the favored tercile: 40, 50, 60, 70%+
Observed
Departure from normal: steps at ±0.5, 1, 2, 3°F
Precipitation

Outlooks
Probability of the favored tercile: 40, 50, 60, 70%+
Observed
Percent of normal: steps at 50, 70, 80, 90, 110, 120, 130, 150%
NDJ 2016-17 issued October 2016
Temperature: 76% accurate, opposite extreme 10% (NOAA CPC 71%, 6%)
Precipitation: 50% accurate, opposite extreme 18% (NOAA CPC 15%, 49%)
Temperature


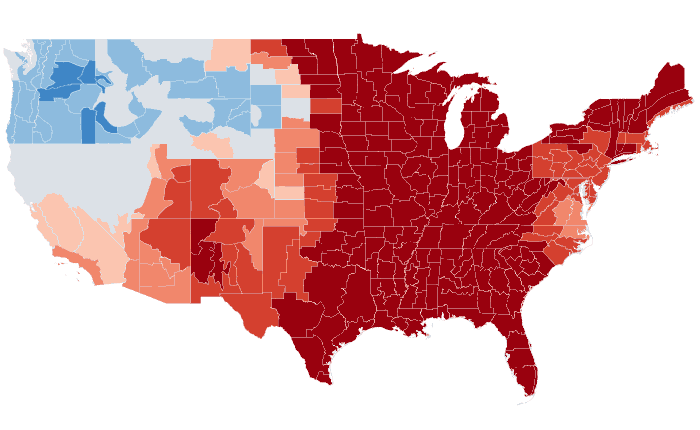
Outlooks
Probability of the favored tercile: 40, 50, 60, 70%+
Observed
Departure from normal: steps at ±0.5, 1, 2, 3°F
Precipitation
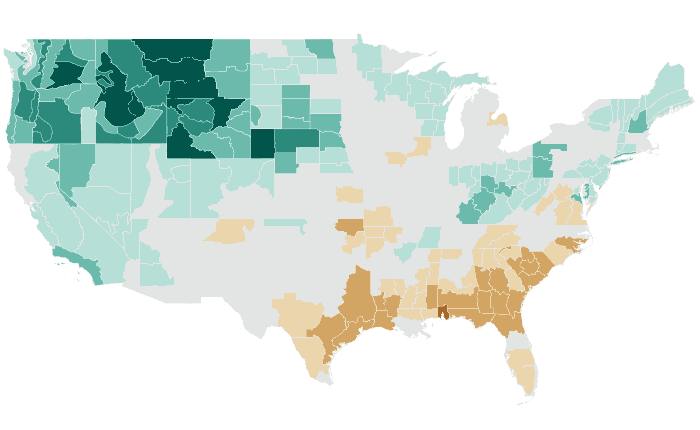


Outlooks
Probability of the favored tercile: 40, 50, 60, 70%+
Observed
Percent of normal: steps at 50, 70, 80, 90, 110, 120, 130, 150%
OND 2016 issued September 2016
Temperature: 91% accurate, opposite extreme 2% (NOAA CPC 83%, 4%)
Precipitation: 58% accurate, opposite extreme 9% (NOAA CPC 85%, 7%)
Temperature
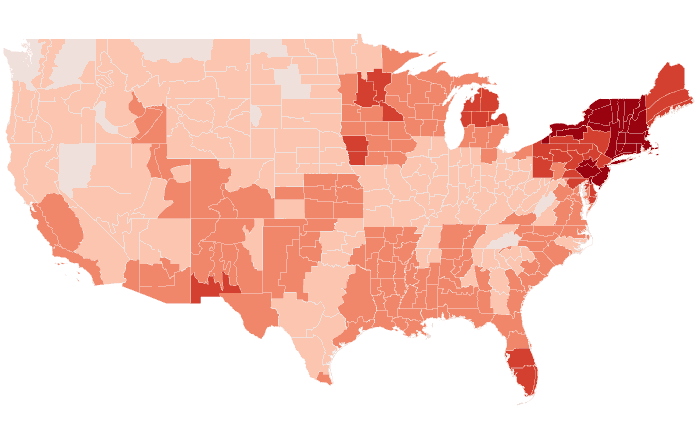


Outlooks
Probability of the favored tercile: 40, 50, 60, 70%+
Observed
Departure from normal: steps at ±0.5, 1, 2, 3°F
Precipitation
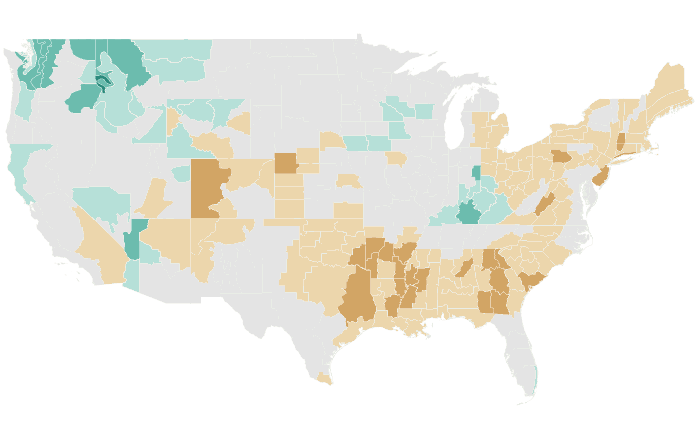

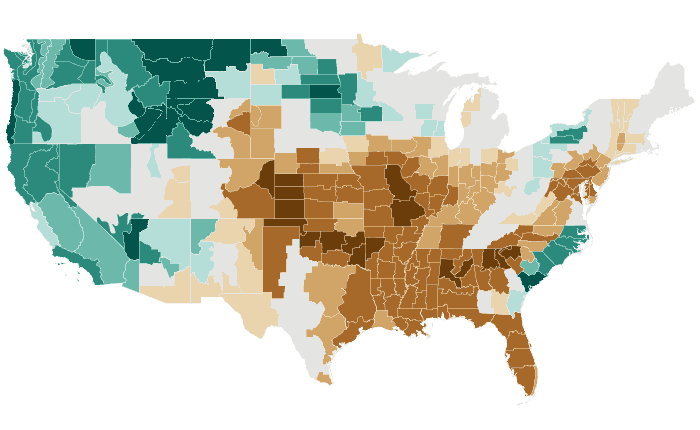
Outlooks
Probability of the favored tercile: 40, 50, 60, 70%+
Observed
Percent of normal: steps at 50, 70, 80, 90, 110, 120, 130, 150%
SON 2016 issued August 2016
Temperature: 97% accurate, opposite extreme 0% (NOAA CPC 97%, 0%)
Precipitation: 50% accurate, opposite extreme 17% (NOAA CPC 84%, 16%)
Temperature
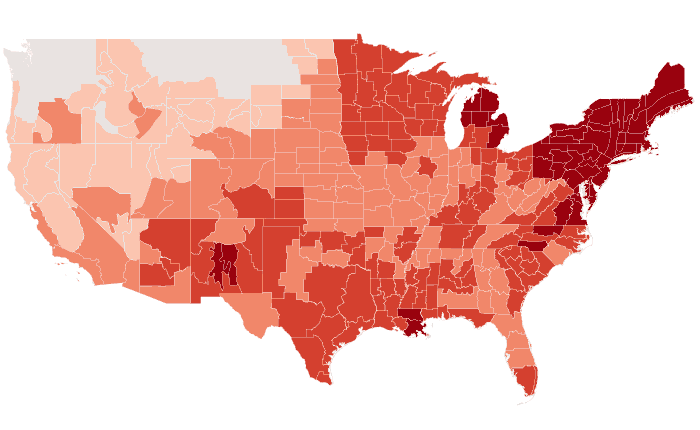
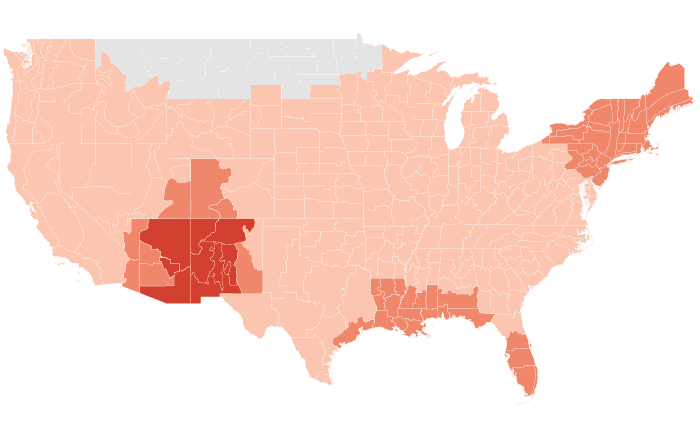
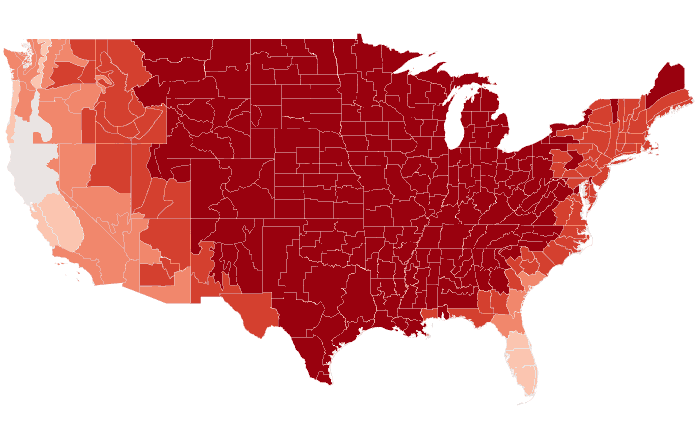
Outlooks
Probability of the favored tercile: 40, 50, 60, 70%+
Observed
Departure from normal: steps at ±0.5, 1, 2, 3°F
Precipitation


Outlooks
Probability of the favored tercile: 40, 50, 60, 70%+
Observed
Percent of normal: steps at 50, 70, 80, 90, 110, 120, 130, 150%
ASO 2016 issued July 2016
Temperature: 84% accurate, opposite extreme 0% (NOAA CPC 84%, 0%)
Precipitation: 50% accurate, opposite extreme 20% (NOAA CPC 64%, 10%)
Temperature
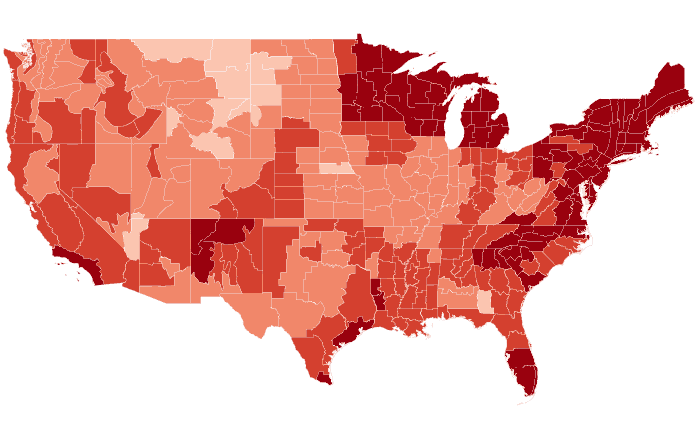


Outlooks
Probability of the favored tercile: 40, 50, 60, 70%+
Observed
Departure from normal: steps at ±0.5, 1, 2, 3°F
Precipitation
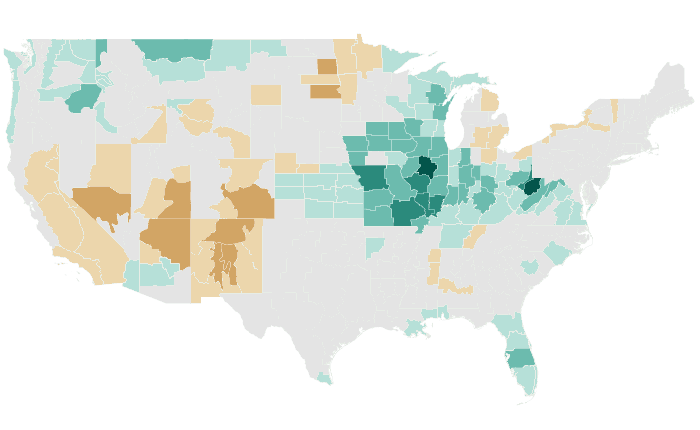


Outlooks
Probability of the favored tercile: 40, 50, 60, 70%+
Observed
Percent of normal: steps at 50, 70, 80, 90, 110, 120, 130, 150%
JAS 2016 issued June 2016
Temperature: 63% accurate, opposite extreme 2% (NOAA CPC 59%, 2%)
Precipitation: 62% accurate, opposite extreme 15% (NOAA CPC 31%, 0%)
Temperature
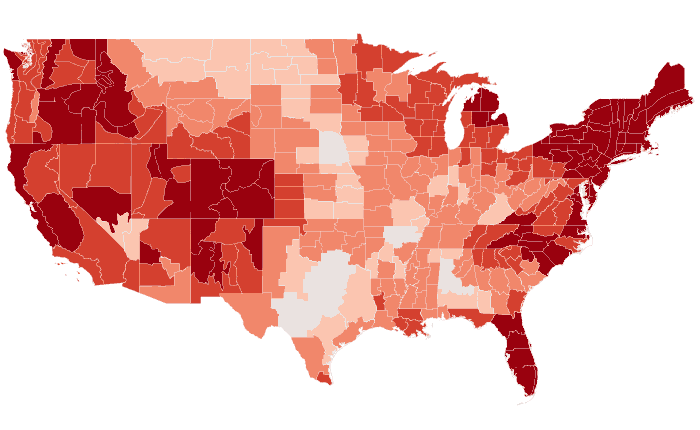


Outlooks
Probability of the favored tercile: 40, 50, 60, 70%+
Observed
Departure from normal: steps at ±0.5, 1, 2, 3°F
Precipitation
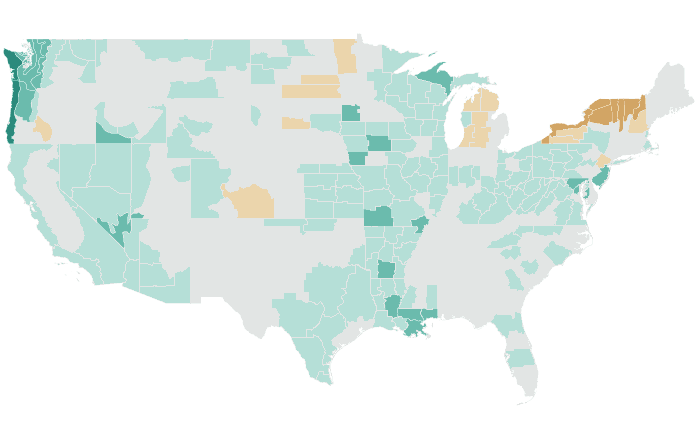
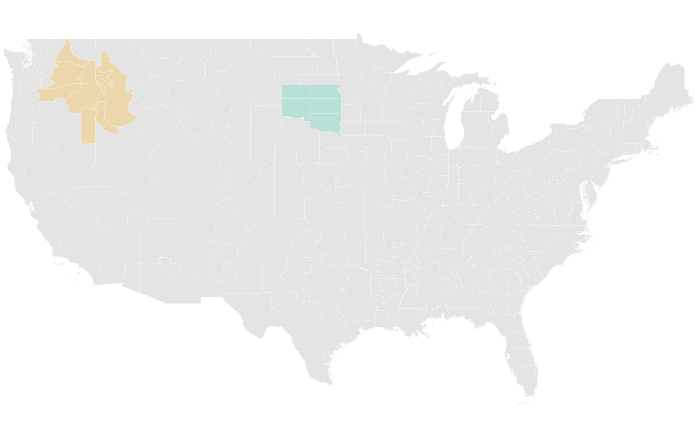

Outlooks
Probability of the favored tercile: 40, 50, 60, 70%+
Observed
Percent of normal: steps at 50, 70, 80, 90, 110, 120, 130, 150%
JJA 2016 issued May 2016
Temperature: 89% accurate, opposite extreme 2% (NOAA CPC 92%, 0%)
Precipitation: 38% accurate, opposite extreme 26% (NOAA CPC 0%, 58%)
Temperature
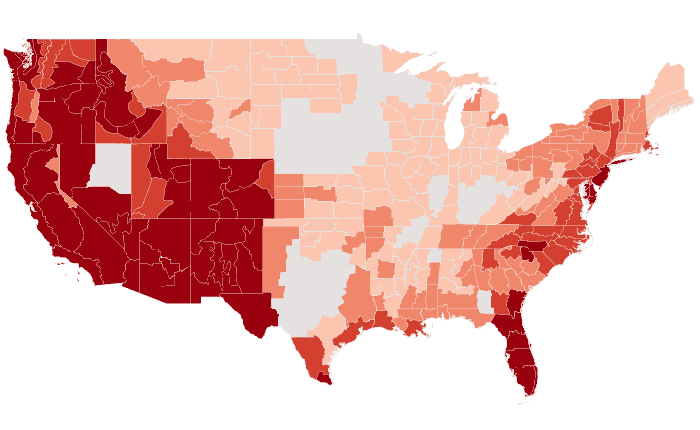
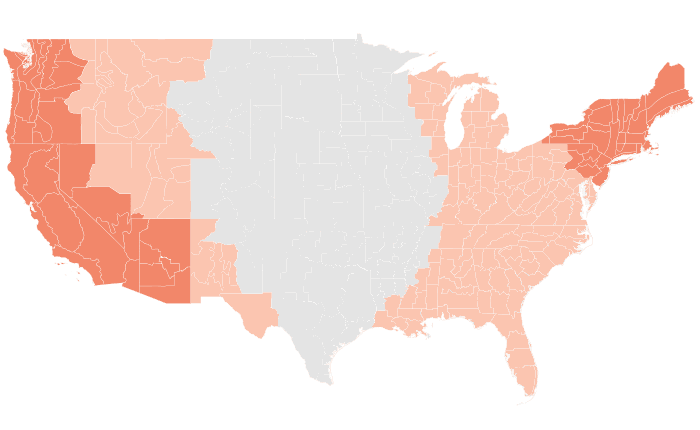

Outlooks
Probability of the favored tercile: 40, 50, 60, 70%+
Observed
Departure from normal: steps at ±0.5, 1, 2, 3°F
Precipitation


Outlooks
Probability of the favored tercile: 40, 50, 60, 70%+
Observed
Percent of normal: steps at 50, 70, 80, 90, 110, 120, 130, 150%
MJJ 2016 issued April 2016
Temperature: 92% accurate, opposite extreme 0% (NOAA CPC 91%, 0%)
Precipitation: 34% accurate, opposite extreme 30% (NOAA CPC 6%, 72%)
Temperature


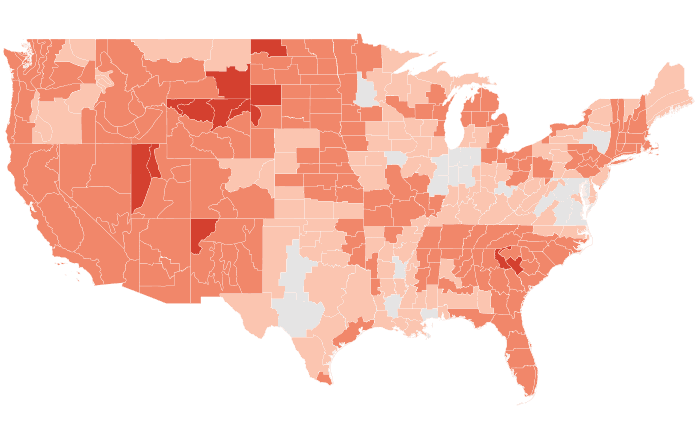
Outlooks
Probability of the favored tercile: 40, 50, 60, 70%+
Observed
Departure from normal: steps at ±0.5, 1, 2, 3°F
Precipitation

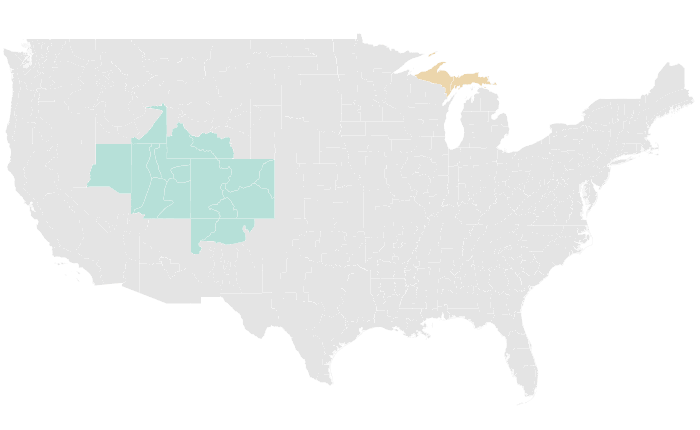

Outlooks
Probability of the favored tercile: 40, 50, 60, 70%+
Observed
Percent of normal: steps at 50, 70, 80, 90, 110, 120, 130, 150%
AMJ 2016 issued March 2016
Temperature: 67% accurate, opposite extreme 2% (NOAA CPC 69%, 4%)
Precipitation: 56% accurate, opposite extreme 12% (NOAA CPC 50%, 5%)
Temperature


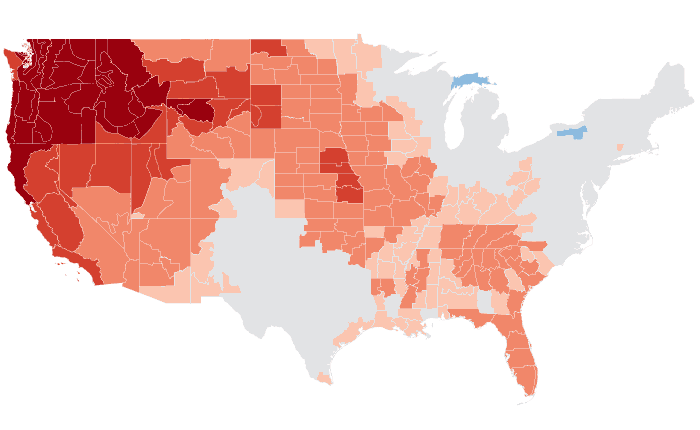
Outlooks
Probability of the favored tercile: 40, 50, 60, 70%+
Observed
Departure from normal: steps at ±0.5, 1, 2, 3°F
Precipitation


Outlooks
Probability of the favored tercile: 40, 50, 60, 70%+
Observed
Percent of normal: steps at 50, 70, 80, 90, 110, 120, 130, 150%
MAM 2016 issued February 2016
Temperature: 87% accurate, opposite extreme 2% (NOAA CPC 81%, 8%)
Precipitation: 49% accurate, opposite extreme 13% (NOAA CPC 30%, 18%)
Temperature
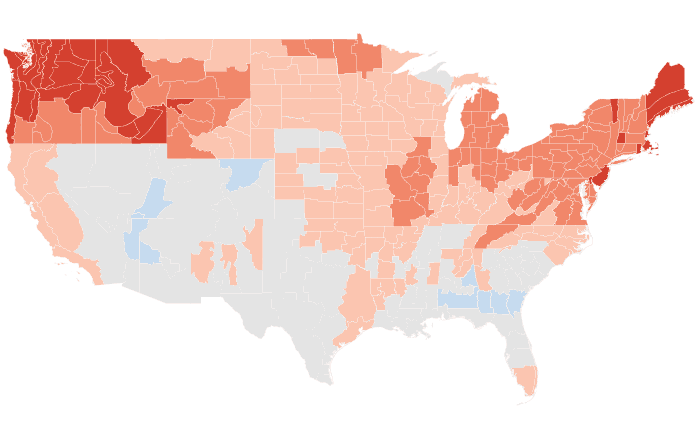


Outlooks
Probability of the favored tercile: 40, 50, 60, 70%+
Observed
Departure from normal: steps at ±0.5, 1, 2, 3°F
Precipitation


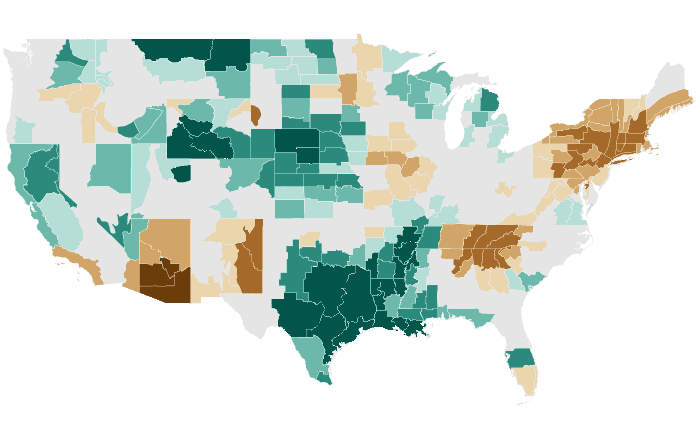
Outlooks
Probability of the favored tercile: 40, 50, 60, 70%+
Observed
Percent of normal: steps at 50, 70, 80, 90, 110, 120, 130, 150%
FMA 2016 issued January 2016
Temperature: 55% accurate, opposite extreme 43% (NOAA CPC 86%, 10%)
Precipitation: 46% accurate, opposite extreme 27% (NOAA CPC 24%, 52%)
Temperature


Outlooks
Probability of the favored tercile: 40, 50, 60, 70%+
Observed
Departure from normal: steps at ±0.5, 1, 2, 3°F
Precipitation
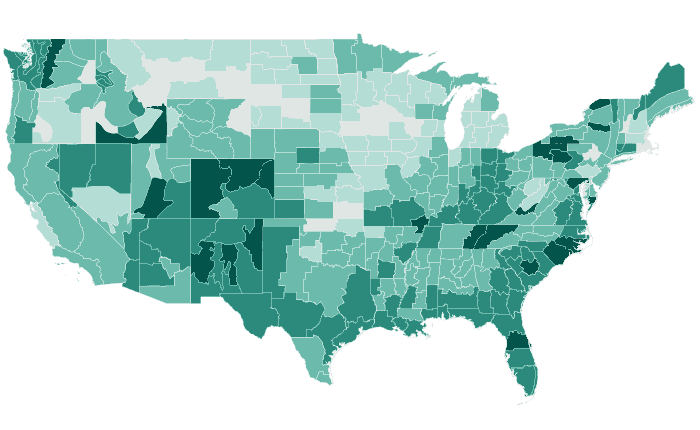


Outlooks
Probability of the favored tercile: 40, 50, 60, 70%+
Observed
Percent of normal: steps at 50, 70, 80, 90, 110, 120, 130, 150%
JFM 2016 issued December 2015
Temperature: 39% accurate, opposite extreme 45% (NOAA CPC 89%, 11%)
Precipitation: 31% accurate, opposite extreme 30% (NOAA CPC 13%, 50%)
Temperature

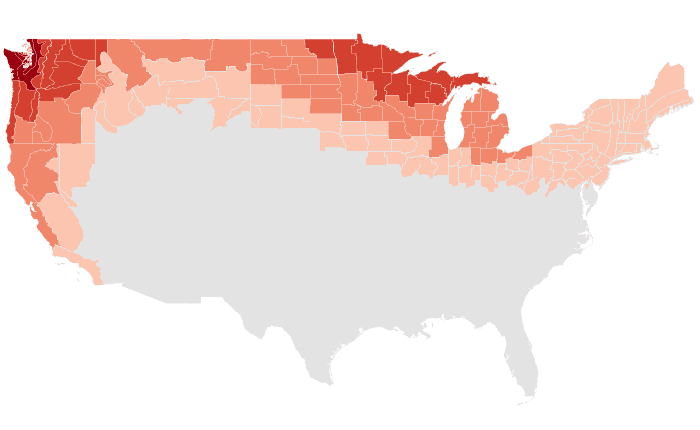

Outlooks
Probability of the favored tercile: 40, 50, 60, 70%+
Observed
Departure from normal: steps at ±0.5, 1, 2, 3°F
Precipitation


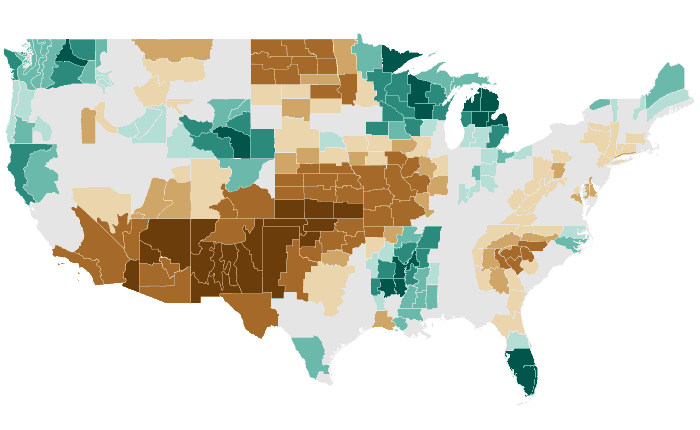
Outlooks
Probability of the favored tercile: 40, 50, 60, 70%+
Observed
Percent of normal: steps at 50, 70, 80, 90, 110, 120, 130, 150%
DJF 2015-16 issued November 2015
Temperature: 56% accurate, opposite extreme 30% (NOAA CPC 92%, 2%)
Precipitation: 48% accurate, opposite extreme 12% (NOAA CPC 24%, 22%)
Temperature

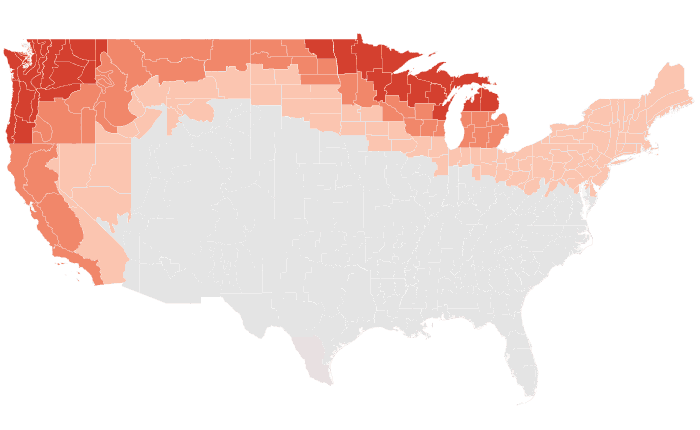

Outlooks
Probability of the favored tercile: 40, 50, 60, 70%+
Observed
Departure from normal: steps at ±0.5, 1, 2, 3°F
Precipitation
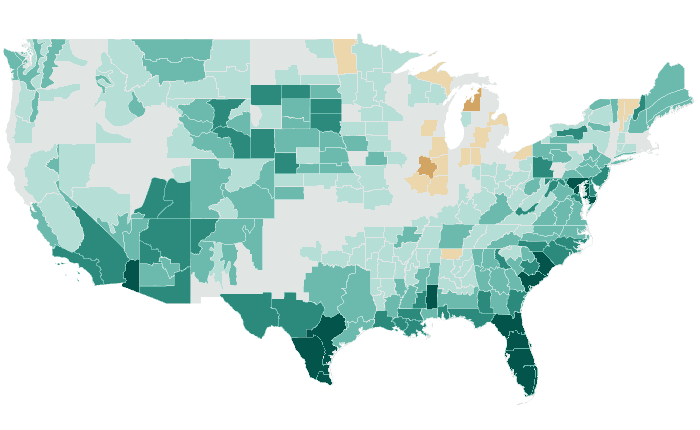
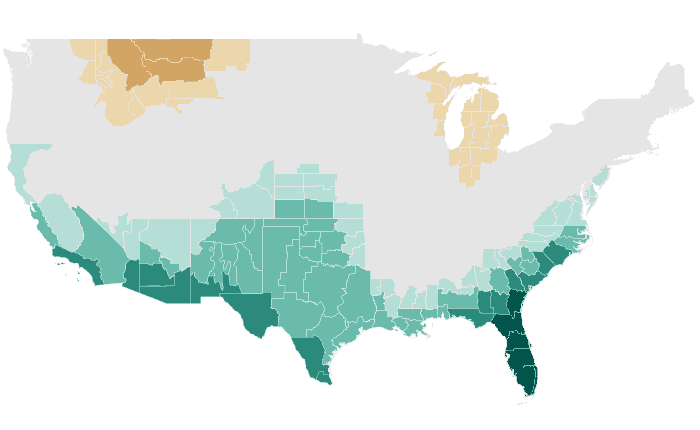

Outlooks
Probability of the favored tercile: 40, 50, 60, 70%+
Observed
Percent of normal: steps at 50, 70, 80, 90, 110, 120, 130, 150%
NDJ 2015-16 issued October 2015
Temperature: 39% accurate, opposite extreme 43% (NOAA CPC 53%, 26%)
Precipitation: 57% accurate, opposite extreme 8% (NOAA CPC 52%, 11%)
Temperature


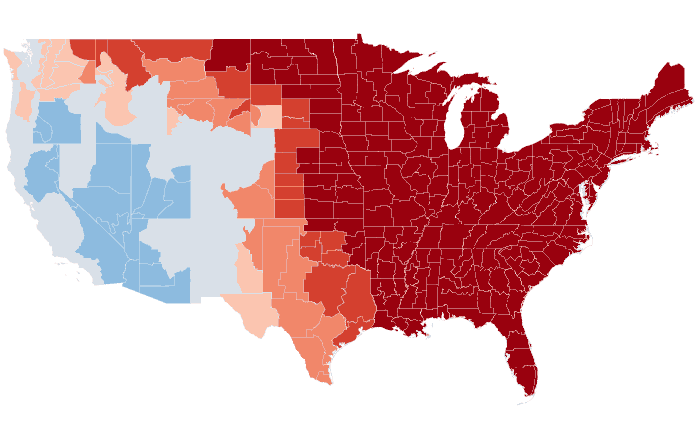
Outlooks
Probability of the favored tercile: 40, 50, 60, 70%+
Observed
Departure from normal: steps at ±0.5, 1, 2, 3°F
Precipitation
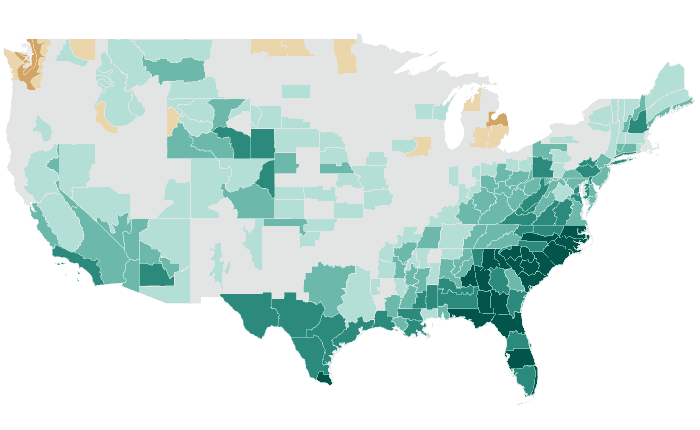
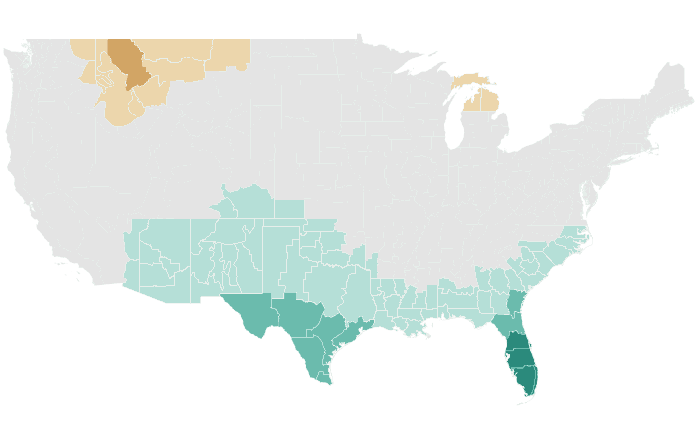
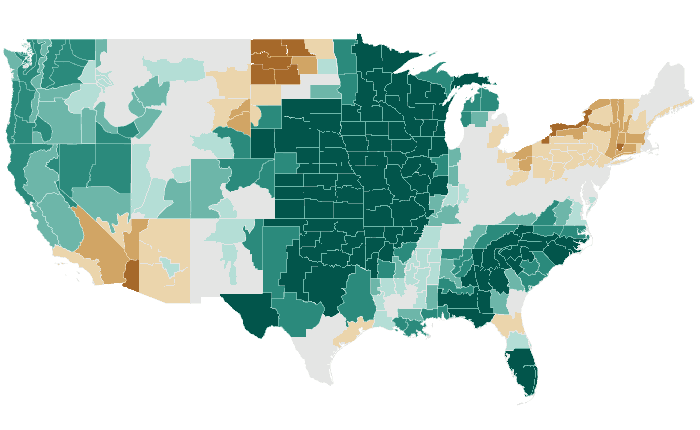
Outlooks
Probability of the favored tercile: 40, 50, 60, 70%+
Observed
Percent of normal: steps at 50, 70, 80, 90, 110, 120, 130, 150%
OND 2015 issued September 2015
Temperature: 64% accurate, opposite extreme 9% (NOAA CPC 83%, 8%)
Precipitation: 61% accurate, opposite extreme 8% (NOAA CPC 76%, 12%)
Temperature


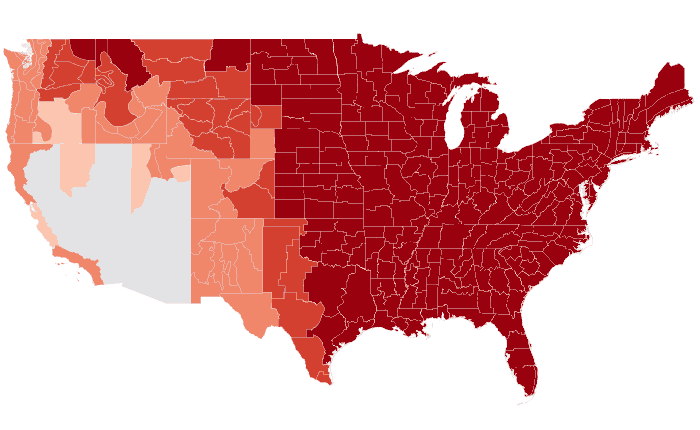
Outlooks
Probability of the favored tercile: 40, 50, 60, 70%+
Observed
Departure from normal: steps at ±0.5, 1, 2, 3°F
Precipitation
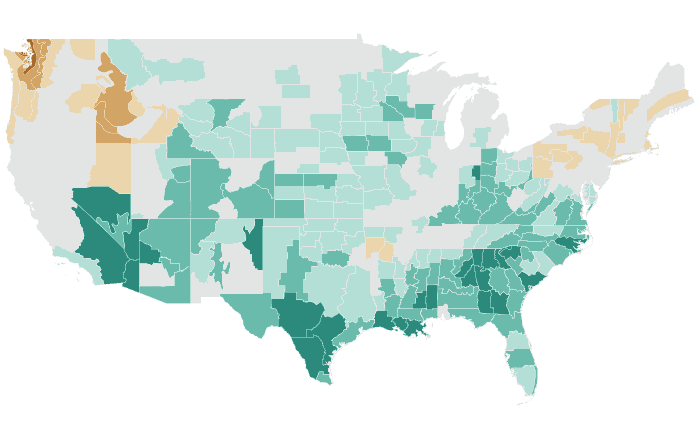

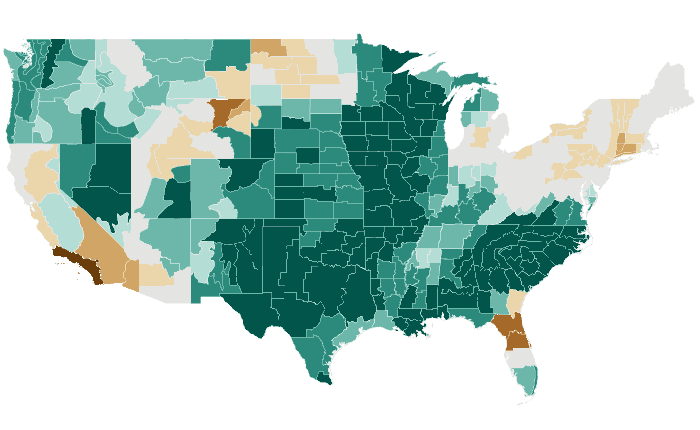
Outlooks
Probability of the favored tercile: 40, 50, 60, 70%+
Observed
Percent of normal: steps at 50, 70, 80, 90, 110, 120, 130, 150%
SON 2015 issued August 2015
Temperature: 77% accurate, opposite extreme 11% (NOAA CPC 83%, 14%)
Precipitation: 56% accurate, opposite extreme 11% (NOAA CPC 50%, 3%)
Temperature


Outlooks
Probability of the favored tercile: 40, 50, 60, 70%+
Observed
Departure from normal: steps at ±0.5, 1, 2, 3°F
Precipitation
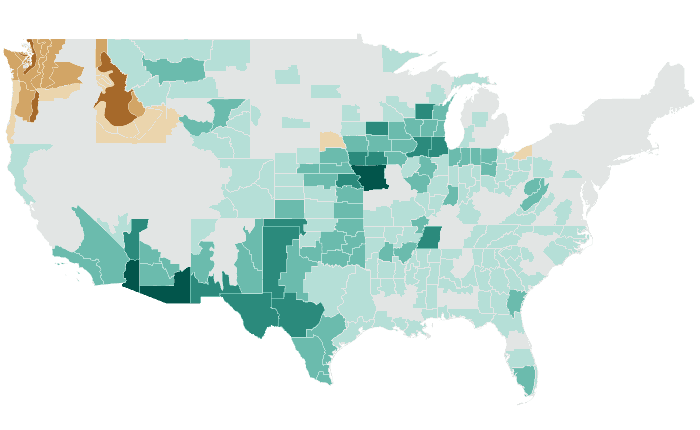
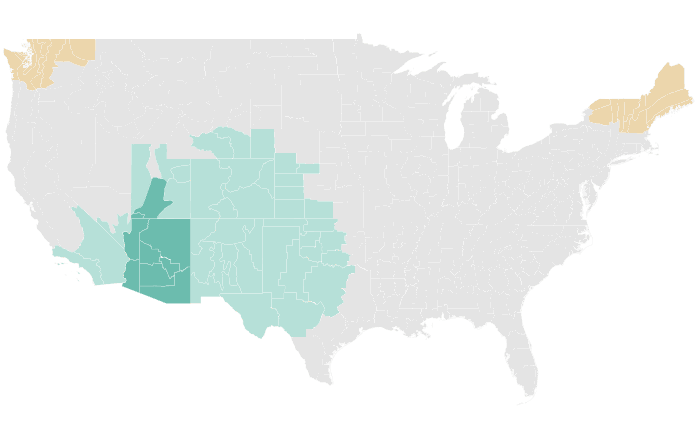

Outlooks
Probability of the favored tercile: 40, 50, 60, 70%+
Observed
Percent of normal: steps at 50, 70, 80, 90, 110, 120, 130, 150%
ASO 2015 issued July 2015
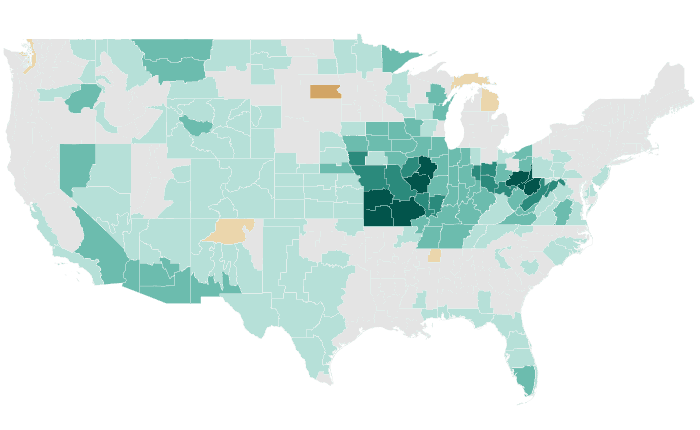
Temperature: 90% accurate, opposite extreme 0% (NOAA CPC 67%, 33%)
Precipitation: 40% accurate, opposite extreme 27% (NOAA CPC 36%, 40%)
Temperature

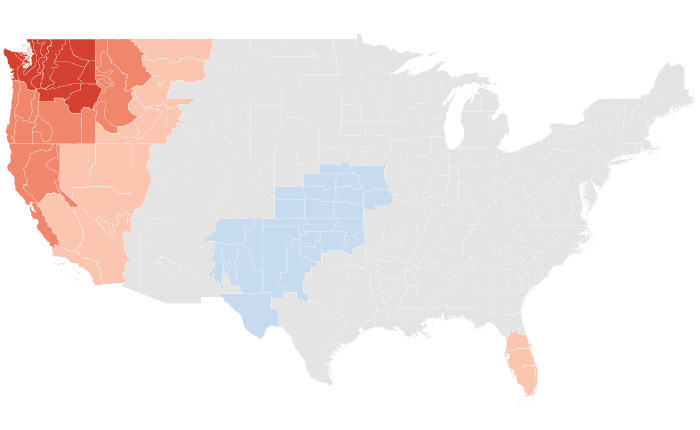
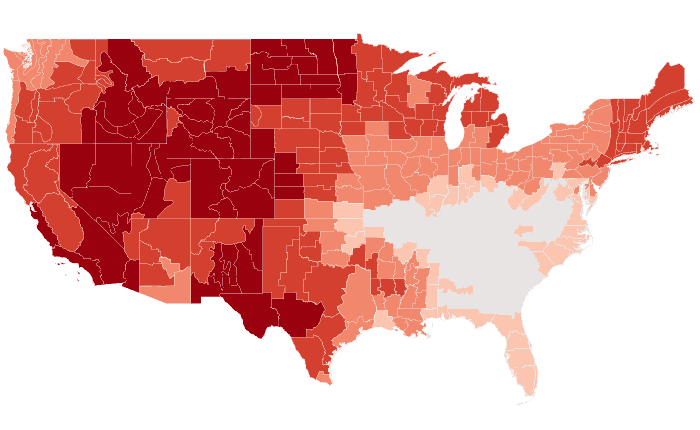
Outlooks
Probability of the favored tercile: 40, 50, 60, 70%+
Observed
Departure from normal: steps at ±0.5, 1, 2, 3°F
Precipitation

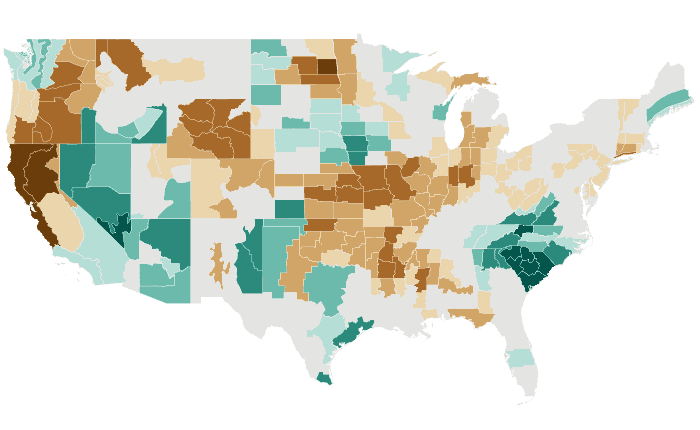
Outlooks
Probability of the favored tercile: 40, 50, 60, 70%+
Observed
Percent of normal: steps at 50, 70, 80, 90, 110, 120, 130, 150%
JAS 2015 issued June 2015
Temperature: 74% accurate, opposite extreme 1% (NOAA CPC 54%, 20%)
Precipitation: 44% accurate, opposite extreme 24% (NOAA CPC 28%, 33%)
Temperature

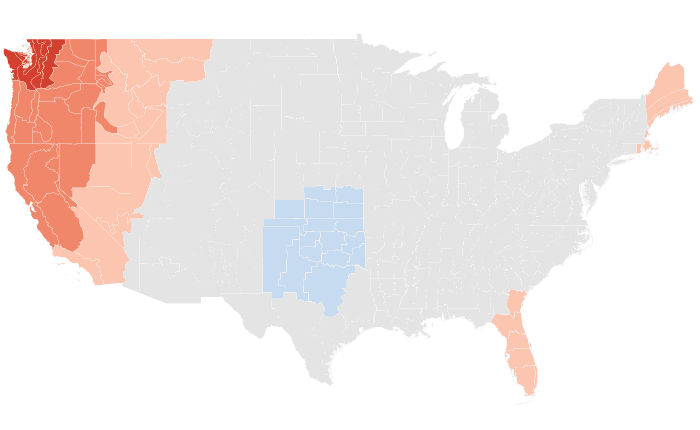
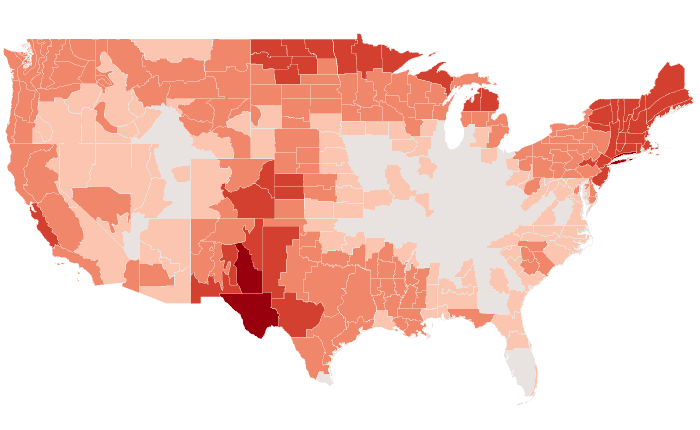
Outlooks
Probability of the favored tercile: 40, 50, 60, 70%+
Observed
Departure from normal: steps at ±0.5, 1, 2, 3°F
Precipitation
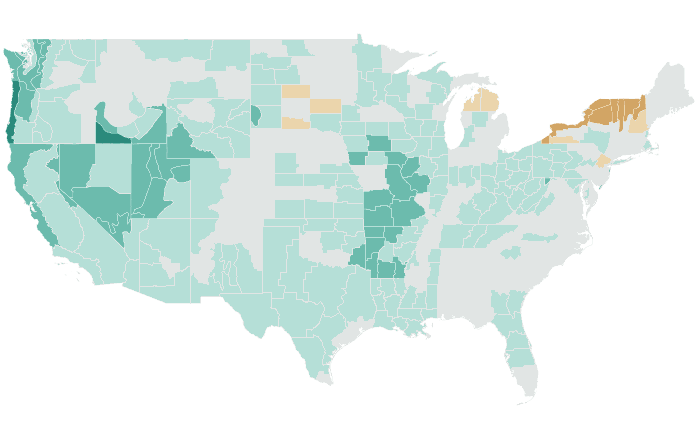

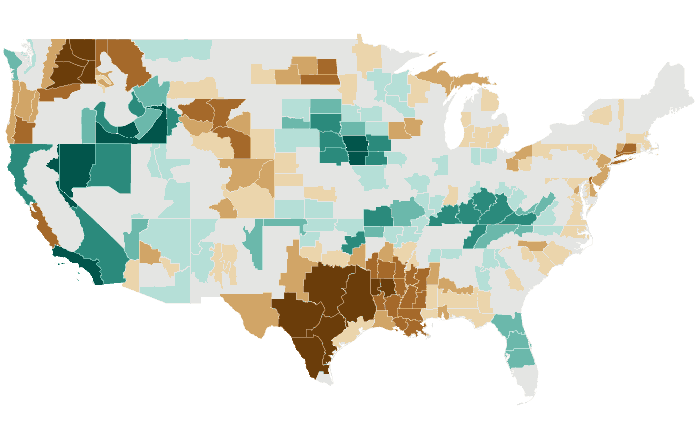
Outlooks
Probability of the favored tercile: 40, 50, 60, 70%+
Observed
Percent of normal: steps at 50, 70, 80, 90, 110, 120, 130, 150%
JJA 2015 issued May 2015
Temperature: 76% accurate, opposite extreme 2% (NOAA CPC 61%, 16%)
Precipitation: 53% accurate, opposite extreme 16% (NOAA CPC 45%, 4%)
Temperature

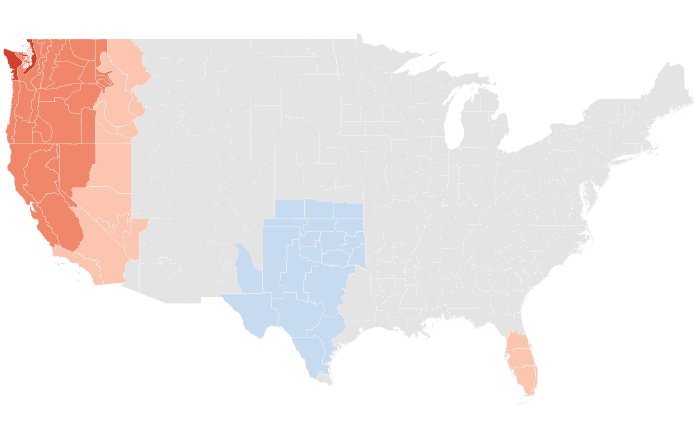

Outlooks
Probability of the favored tercile: 40, 50, 60, 70%+
Observed
Departure from normal: steps at ±0.5, 1, 2, 3°F
Precipitation
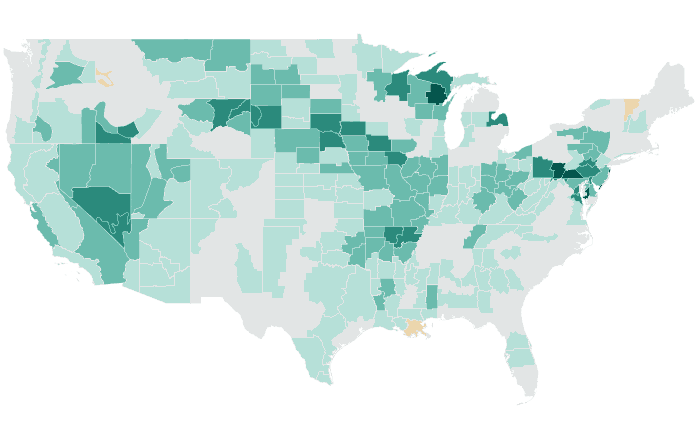


Outlooks
Probability of the favored tercile: 40, 50, 60, 70%+
Observed
Percent of normal: steps at 50, 70, 80, 90, 110, 120, 130, 150%
MJJ 2015 issued April 2015
Temperature: 56% accurate, opposite extreme 14% (NOAA CPC 67%, 11%)
Precipitation: 62% accurate, opposite extreme 15% (NOAA CPC 82%, 1%)
Temperature
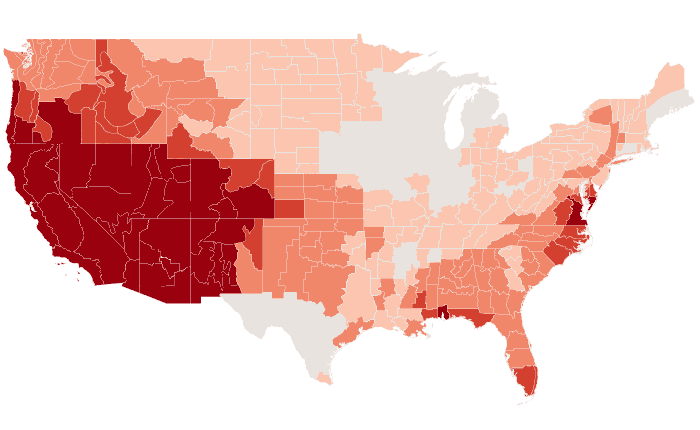

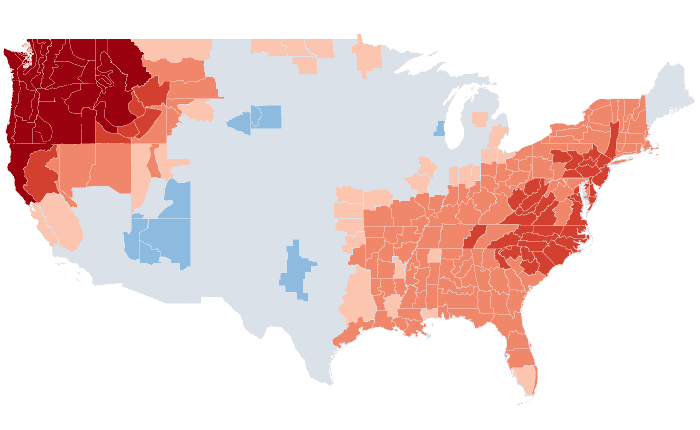
Outlooks
Probability of the favored tercile: 40, 50, 60, 70%+
Observed
Departure from normal: steps at ±0.5, 1, 2, 3°F
Precipitation


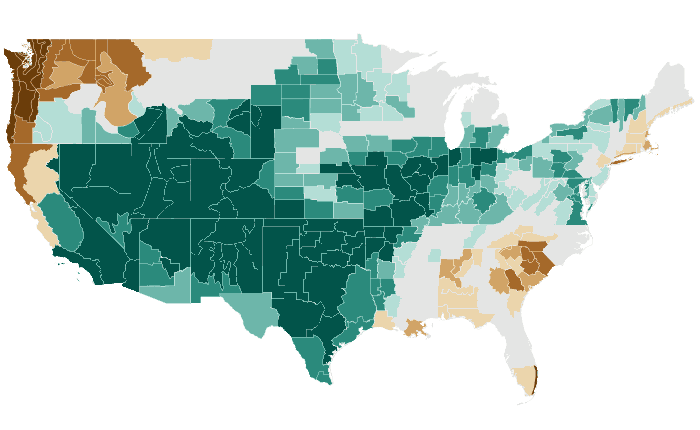
Outlooks
Probability of the favored tercile: 40, 50, 60, 70%+
Observed
Percent of normal: steps at 50, 70, 80, 90, 110, 120, 130, 150%
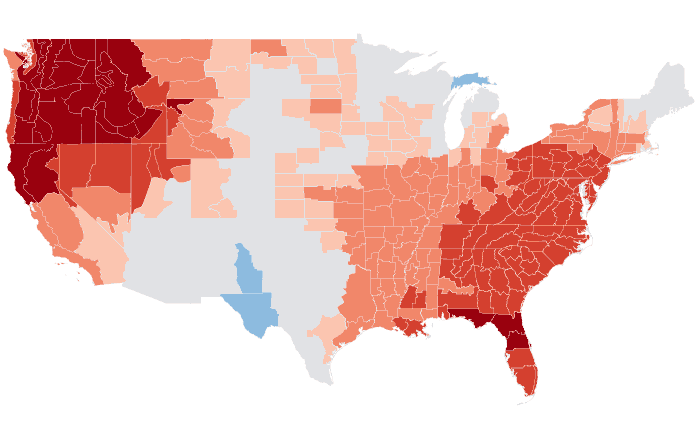
AMJ 2015 issued March 2015
Temperature: 60% accurate, opposite extreme 5% (NOAA CPC 68%, 0%)
Precipitation: 65% accurate, opposite extreme 7% (NOAA CPC 60%, 8%)
Temperature
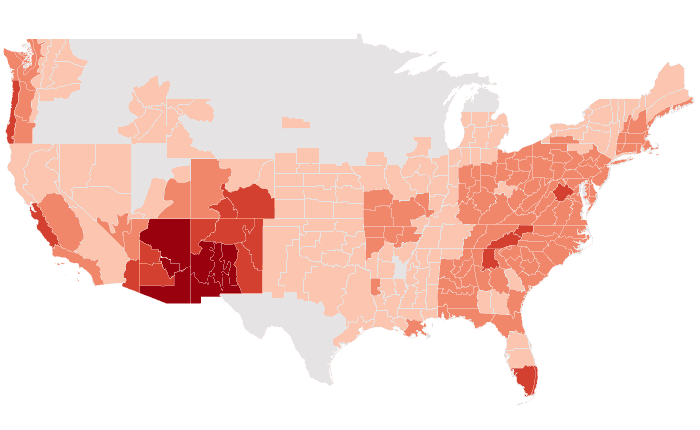

Outlooks
Probability of the favored tercile: 40, 50, 60, 70%+
Observed
Departure from normal: steps at ±0.5, 1, 2, 3°F
Precipitation


Outlooks
Probability of the favored tercile: 40, 50, 60, 70%+
Observed
Percent of normal: steps at 50, 70, 80, 90, 110, 120, 130, 150%
MAM 2015 issued February 2015
Temperature: 61% accurate, opposite extreme 2% (NOAA CPC 77%, 3%)
Precipitation: 61% accurate, opposite extreme 7% (NOAA CPC 97%, 0%)
Temperature


Outlooks
Probability of the favored tercile: 40, 50, 60, 70%+
Observed
Departure from normal: steps at ±0.5, 1, 2, 3°F
Precipitation
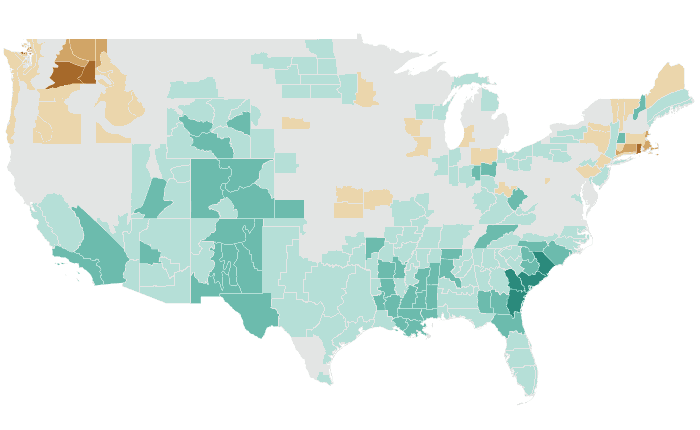


Outlooks
Probability of the favored tercile: 40, 50, 60, 70%+
Observed
Percent of normal: steps at 50, 70, 80, 90, 110, 120, 130, 150%
FMA 2015 issued January 2015
Temperature: 80% accurate, opposite extreme 11% (NOAA CPC 76%, 4%)
Precipitation: 41% accurate, opposite extreme 31% (NOAA CPC 17%, 38%)
Temperature
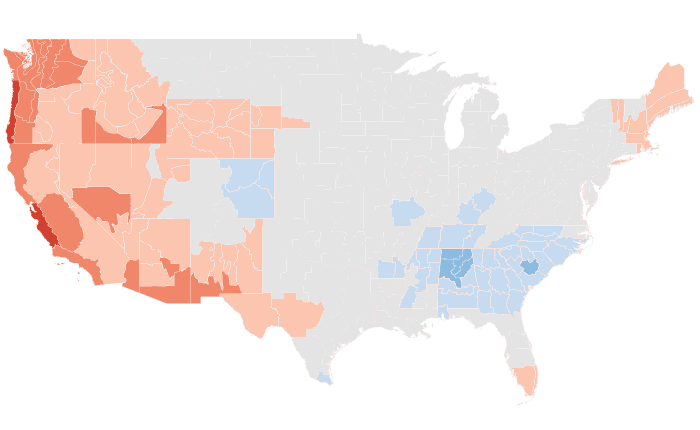


Outlooks
Probability of the favored tercile: 40, 50, 60, 70%+
Observed
Departure from normal: steps at ±0.5, 1, 2, 3°F
Precipitation

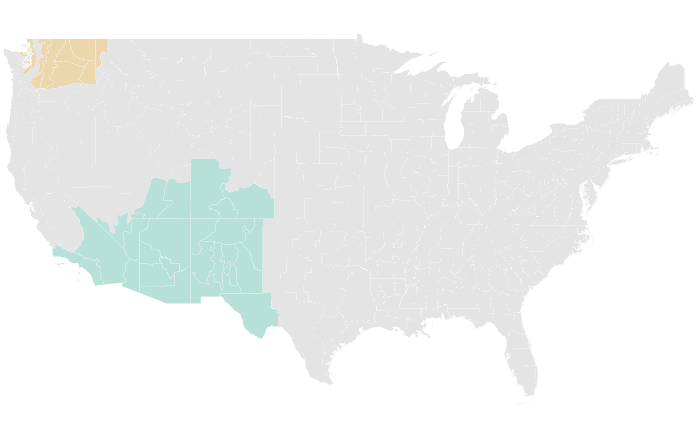
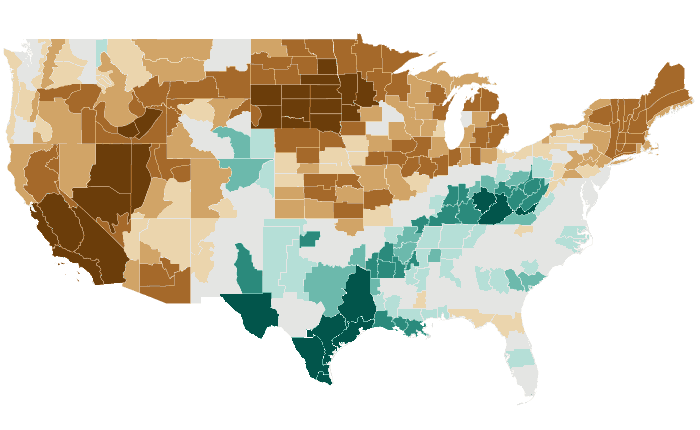
Outlooks
Probability of the favored tercile: 40, 50, 60, 70%+
Observed
Percent of normal: steps at 50, 70, 80, 90, 110, 120, 130, 150%
JFM 2015 issued December 2014
Temperature: 79% accurate, opposite extreme 8% (NOAA CPC 95%, 2%)
Precipitation: 30% accurate, opposite extreme 31% (NOAA CPC 33%, 29%)
Temperature
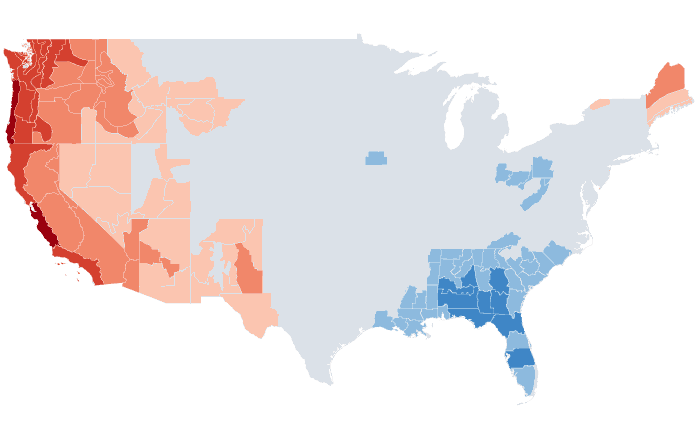


Outlooks
Probability of the favored tercile: 40, 50, 60, 70%+
Observed
Departure from normal: steps at ±0.5, 1, 2, 3°F
Precipitation
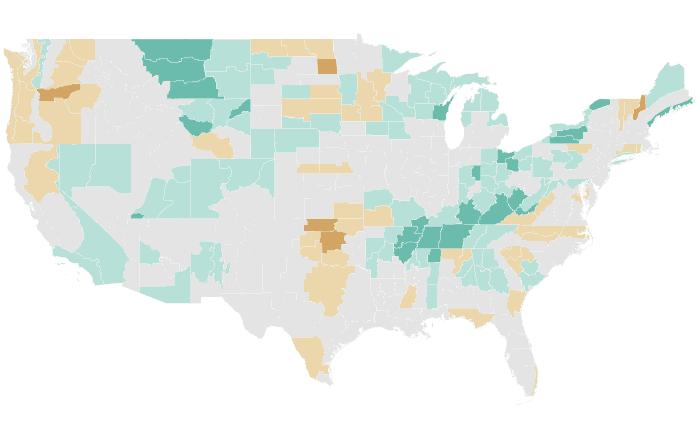
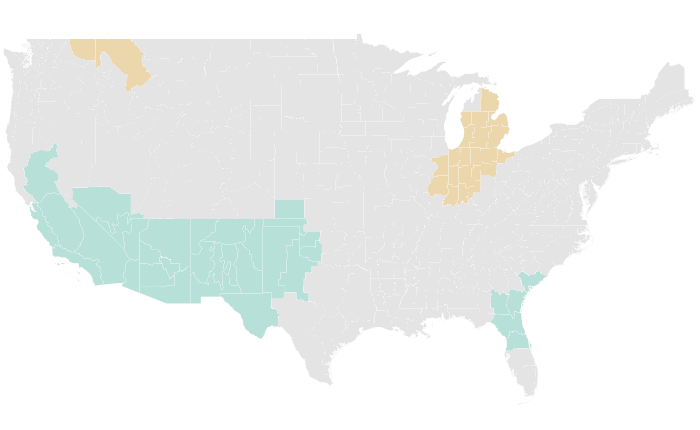

Outlooks
Probability of the favored tercile: 40, 50, 60, 70%+
Observed
Percent of normal: steps at 50, 70, 80, 90, 110, 120, 130, 150%
DJF 2014-15 issued November 2014
Temperature: 74% accurate, opposite extreme 4% (NOAA CPC 78%, 2%)
Precipitation: 46% accurate, opposite extreme 20% (NOAA CPC 34%, 4%)
Temperature
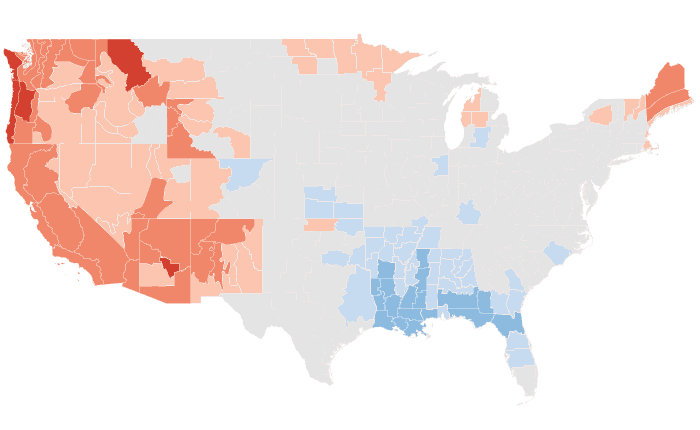


Outlooks
Probability of the favored tercile: 40, 50, 60, 70%+
Observed
Departure from normal: steps at ±0.5, 1, 2, 3°F
Precipitation

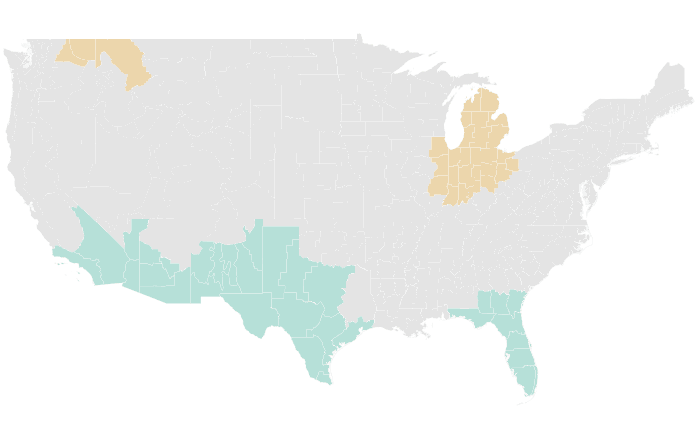
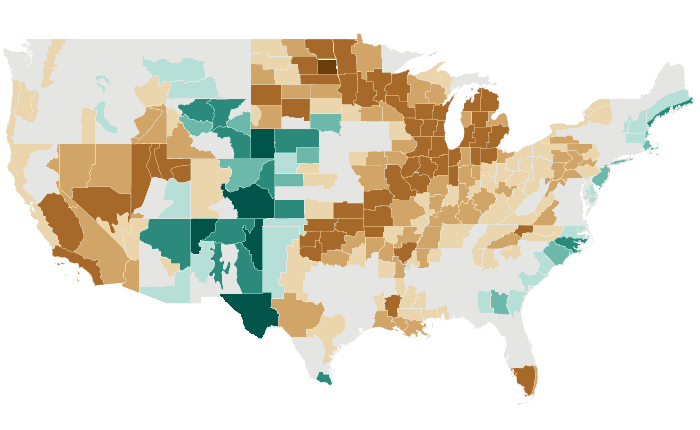
Outlooks
Probability of the favored tercile: 40, 50, 60, 70%+
Observed
Percent of normal: steps at 50, 70, 80, 90, 110, 120, 130, 150%
NDJ 2014-15 issued October 2014
Temperature: 58% accurate, opposite extreme 6% (NOAA CPC 72%, 0%)
Precipitation: 57% accurate, opposite extreme 9% (NOAA CPC 45%, 14%)
Temperature

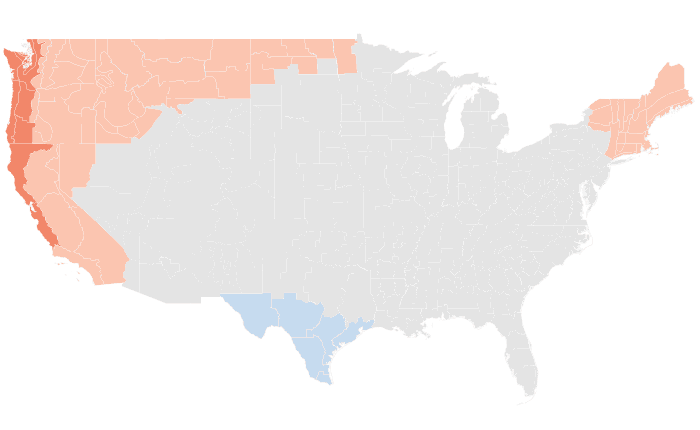
Outlooks
Probability of the favored tercile: 40, 50, 60, 70%+
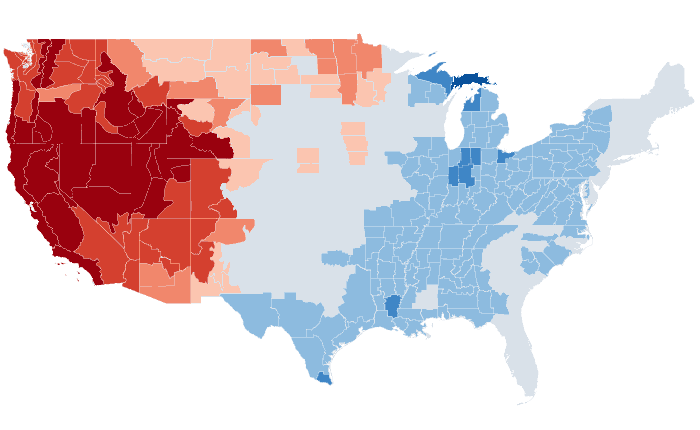
Observed
Departure from normal: steps at ±0.5, 1, 2, 3°F
Precipitation

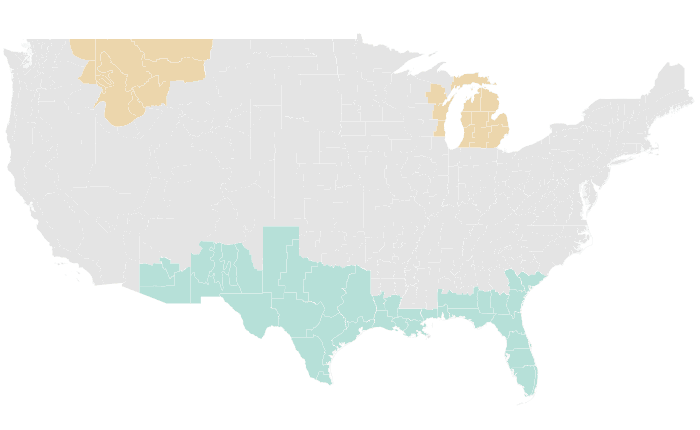

Outlooks
Probability of the favored tercile: 40, 50, 60, 70%+
Observed
Percent of normal: steps at 50, 70, 80, 90, 110, 120, 130, 150%
OND 2014 issued September 2014
Temperature: 64% accurate, opposite extreme 6% (NOAA CPC 79%, 10%)
Precipitation: 47% accurate, opposite extreme 10% (NOAA CPC 2%, 28%)
Temperature


Outlooks
Probability of the favored tercile: 40, 50, 60, 70%+
Observed
Departure from normal: steps at ±0.5, 1, 2, 3°F
Precipitation


Outlooks
Probability of the favored tercile: 40, 50, 60, 70%+
Observed
Percent of normal: steps at 50, 70, 80, 90, 110, 120, 130, 150%
SON 2014 issued August 2014
Temperature: 59% accurate, opposite extreme 17% (NOAA CPC 70%, 10%)
Precipitation: 44% accurate, opposite extreme 15% (NOAA CPC 19%, 21%)
Temperature
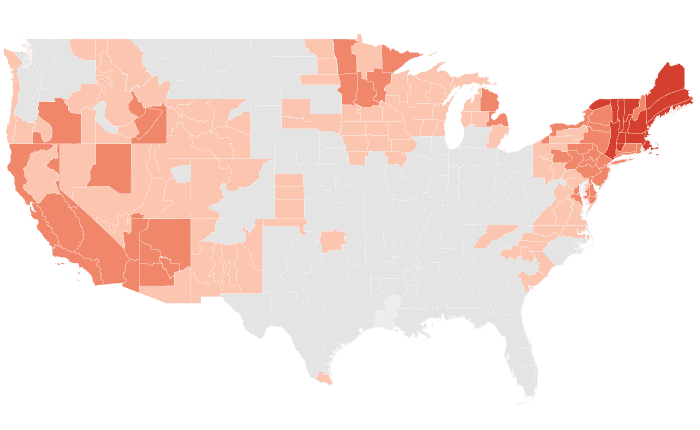
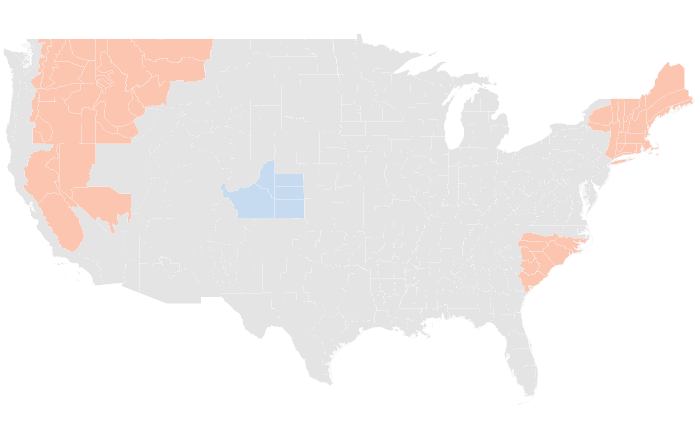
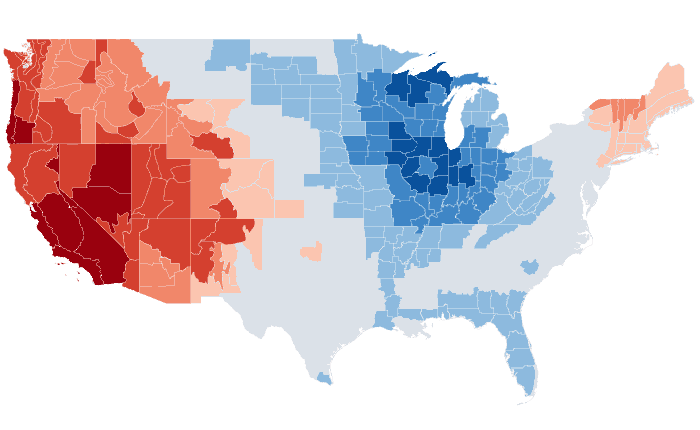
Outlooks
Probability of the favored tercile: 40, 50, 60, 70%+
Observed
Departure from normal: steps at ±0.5, 1, 2, 3°F
Precipitation


Outlooks
Probability of the favored tercile: 40, 50, 60, 70%+
Observed
Percent of normal: steps at 50, 70, 80, 90, 110, 120, 130, 150%
ASO 2014 issued July 2014
Temperature: 74% accurate, opposite extreme 1% (NOAA CPC 70%, 6%)
Precipitation: 62% accurate, opposite extreme 8% (NOAA CPC 68%, 12%)
Temperature


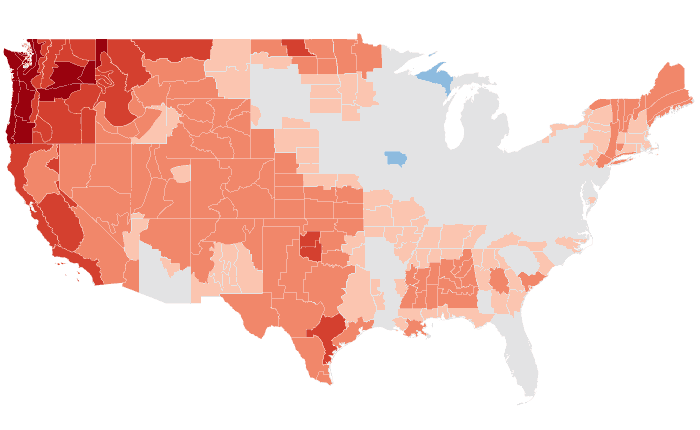
Outlooks
Probability of the favored tercile: 40, 50, 60, 70%+
Observed
Departure from normal: steps at ±0.5, 1, 2, 3°F
Precipitation
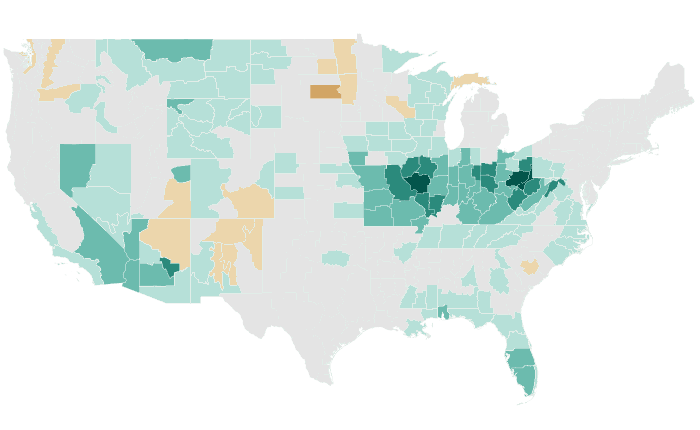
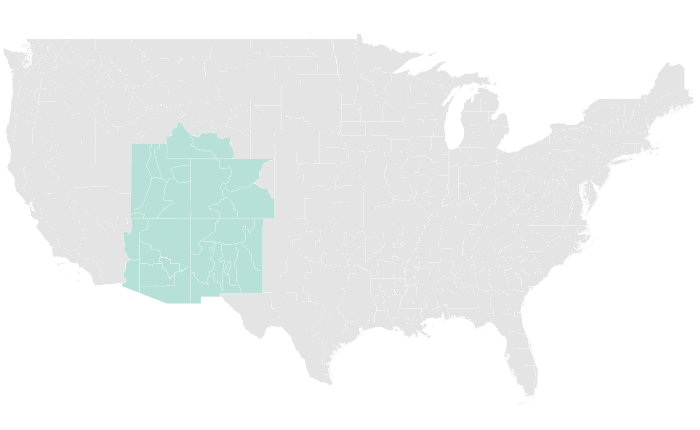

Outlooks
Probability of the favored tercile: 40, 50, 60, 70%+
Observed
Percent of normal: steps at 50, 70, 80, 90, 110, 120, 130, 150%
JAS 2014 issued June 2014
Temperature: 41% accurate, opposite extreme 19% (NOAA CPC 44%, 20%)
Precipitation: 62% accurate, opposite extreme 15% (NOAA CPC 76%, 9%)
Temperature

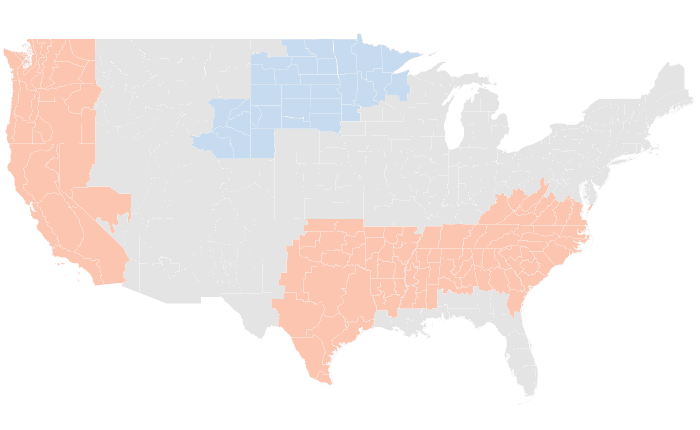
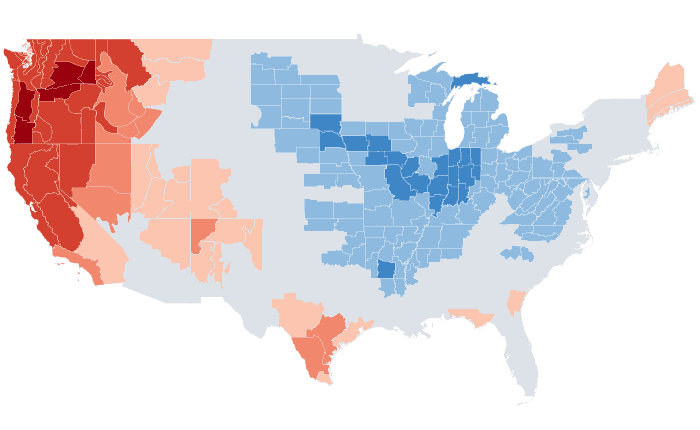
Outlooks
Probability of the favored tercile: 40, 50, 60, 70%+
Observed
Departure from normal: steps at ±0.5, 1, 2, 3°F
Precipitation
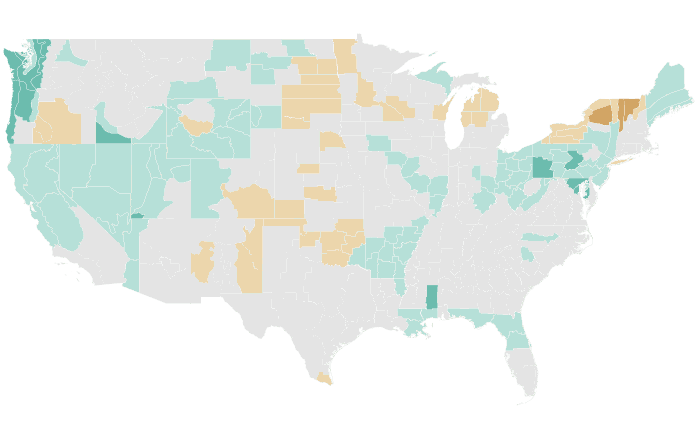


Outlooks
Probability of the favored tercile: 40, 50, 60, 70%+
Observed
Percent of normal: steps at 50, 70, 80, 90, 110, 120, 130, 150%
JJA 2014 issued May 2014
Temperature: 32% accurate, opposite extreme 33% (NOAA CPC 60%, 8%)
Precipitation: 44% accurate, opposite extreme 21% (NOAA CPC 65%, 10%)
Temperature


Outlooks
Probability of the favored tercile: 40, 50, 60, 70%+
Observed
Departure from normal: steps at ±0.5, 1, 2, 3°F
Precipitation
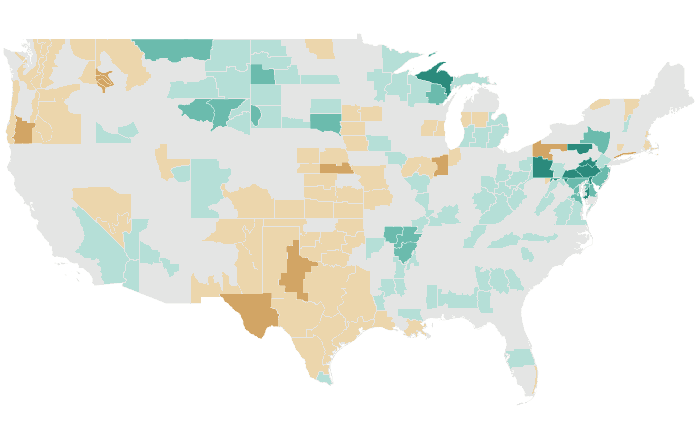

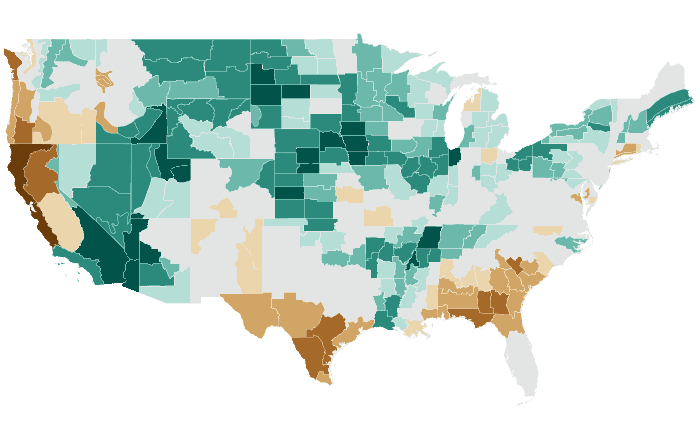
Outlooks
Probability of the favored tercile: 40, 50, 60, 70%+
Observed
Percent of normal: steps at 50, 70, 80, 90, 110, 120, 130, 150%
MJJ 2014 issued April 2014
Temperature: 51% accurate, opposite extreme 21% (NOAA CPC 53%, 16%)
Precipitation: 36% accurate, opposite extreme 21% (NOAA CPC 8%, 22%)
Temperature
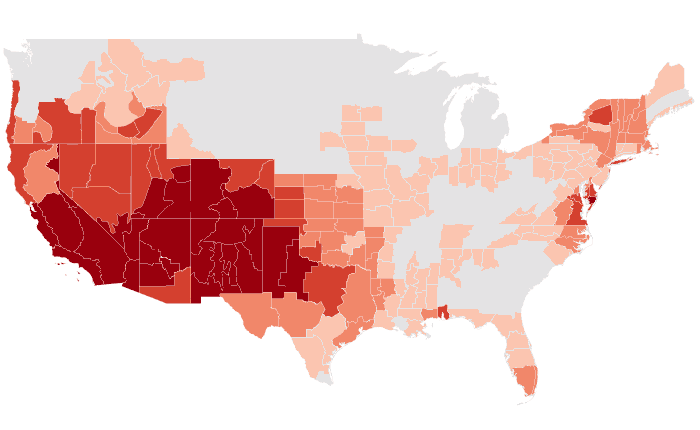

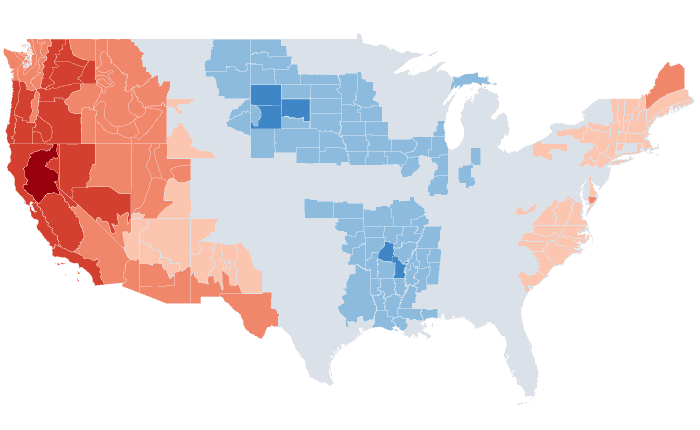
Outlooks
Probability of the favored tercile: 40, 50, 60, 70%+
Observed
Departure from normal: steps at ±0.5, 1, 2, 3°F
Precipitation


Outlooks
Probability of the favored tercile: 40, 50, 60, 70%+
Observed
Percent of normal: steps at 50, 70, 80, 90, 110, 120, 130, 150%
AMJ 2014 issued March 2014
Temperature: 48% accurate, opposite extreme 6% (NOAA CPC 54%, 10%)
Precipitation: 53% accurate, opposite extreme 10% (NOAA CPC 90%, 0%)
Temperature


Outlooks
Probability of the favored tercile: 40, 50, 60, 70%+
Observed
Departure from normal: steps at ±0.5, 1, 2, 3°F
Precipitation

Outlooks
Probability of the favored tercile: 40, 50, 60, 70%+
Observed
Percent of normal: steps at 50, 70, 80, 90, 110, 120, 130, 150%
MAM 2014 issued February 2014
Temperature: 21% accurate, opposite extreme 43% (NOAA CPC 78%, 0%)
Precipitation: 55% accurate, opposite extreme 8% (NOAA CPC 31%, 12%)
Temperature

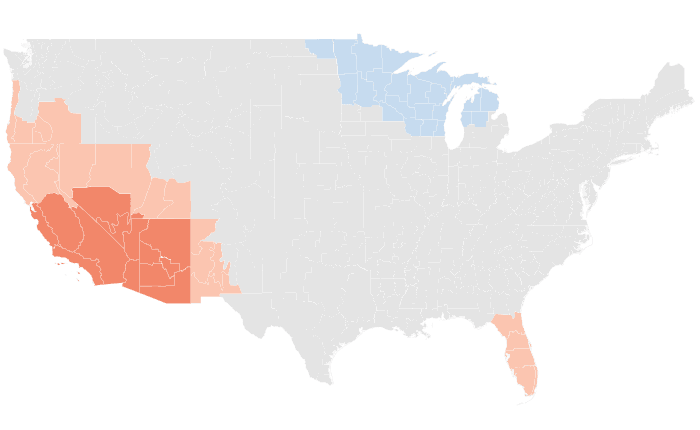

Outlooks
Probability of the favored tercile: 40, 50, 60, 70%+
Observed
Departure from normal: steps at ±0.5, 1, 2, 3°F
Precipitation
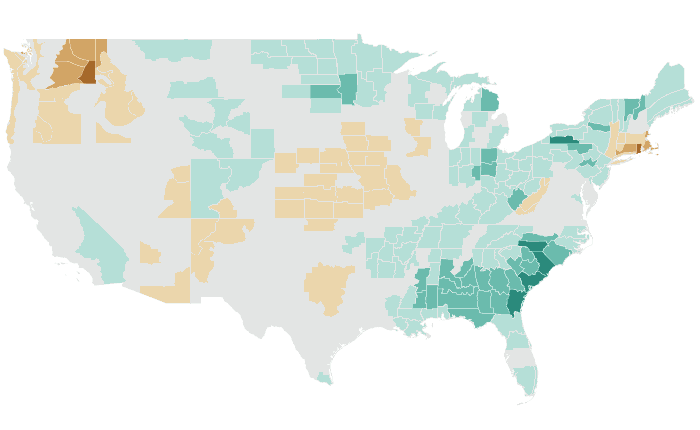


Outlooks
Probability of the favored tercile: 40, 50, 60, 70%+
Observed
Percent of normal: steps at 50, 70, 80, 90, 110, 120, 130, 150%
FMA 2014 issued January 2014
Temperature: 24% accurate, opposite extreme 69% (NOAA CPC 51%, 42%)
Precipitation: 57% accurate, opposite extreme 19% (NOAA CPC 74%, 6%)
Temperature

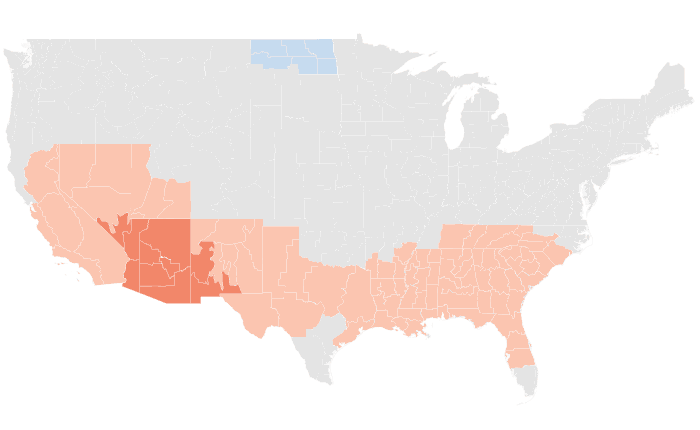

Outlooks
Probability of the favored tercile: 40, 50, 60, 70%+
Observed
Departure from normal: steps at ±0.5, 1, 2, 3°F
Precipitation


Outlooks
Probability of the favored tercile: 40, 50, 60, 70%+
Observed
Percent of normal: steps at 50, 70, 80, 90, 110, 120, 130, 150%
JFM 2014 issued December 2013
Temperature: 32% accurate, opposite extreme 50% (NOAA CPC 30%, 63%)
Precipitation: 43% accurate, opposite extreme 19% (NOAA CPC 77%, 13%)
Temperature
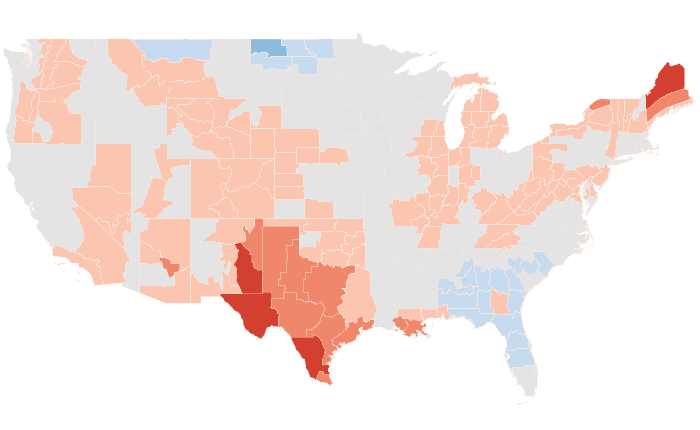


Outlooks
Probability of the favored tercile: 40, 50, 60, 70%+
Observed
Departure from normal: steps at ±0.5, 1, 2, 3°F
Precipitation


Outlooks
Probability of the favored tercile: 40, 50, 60, 70%+
Observed
Percent of normal: steps at 50, 70, 80, 90, 110, 120, 130, 150%
DJF 2013-14 issued November 2013
Temperature: 26% accurate, opposite extreme 42% (NOAA CPC 22%, 66%)
Precipitation: 52% accurate, opposite extreme 6% (NOAA CPC 61%, 11%)
Temperature

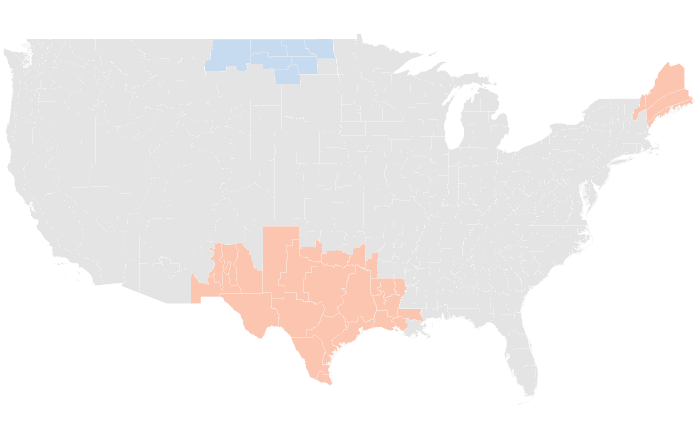
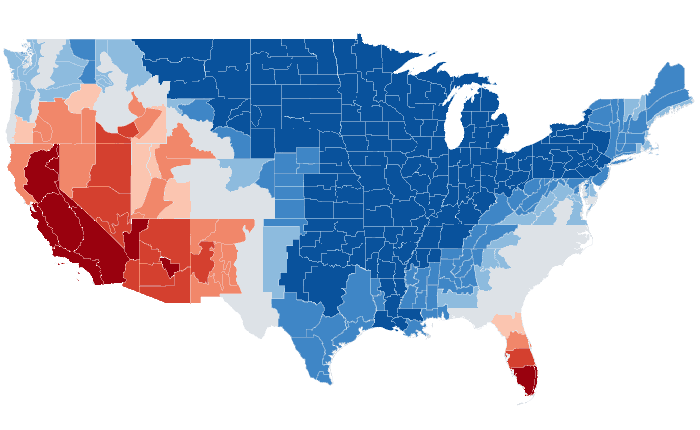
Outlooks
Probability of the favored tercile: 40, 50, 60, 70%+
Observed
Departure from normal: steps at ±0.5, 1, 2, 3°F
Precipitation


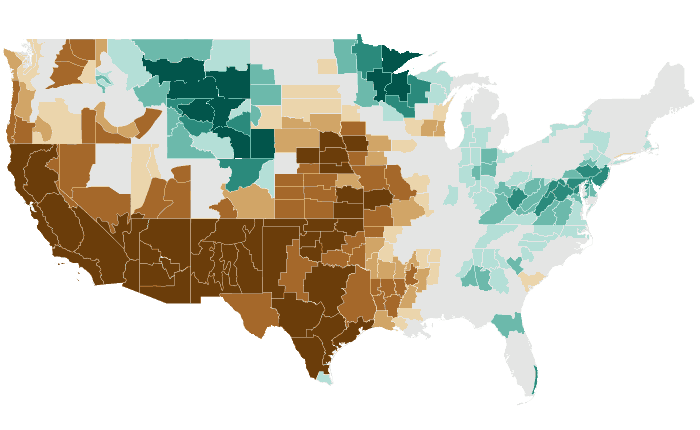
Outlooks
Probability of the favored tercile: 40, 50, 60, 70%+
Observed
Percent of normal: steps at 50, 70, 80, 90, 110, 120, 130, 150%
NDJ 2013-14 issued October 2013
Temperature: 25% accurate, opposite extreme 51% (NOAA CPC 8%, 71%)
Precipitation: 56% accurate, opposite extreme 7% (NOAA CPC 45%, 10%)
Temperature
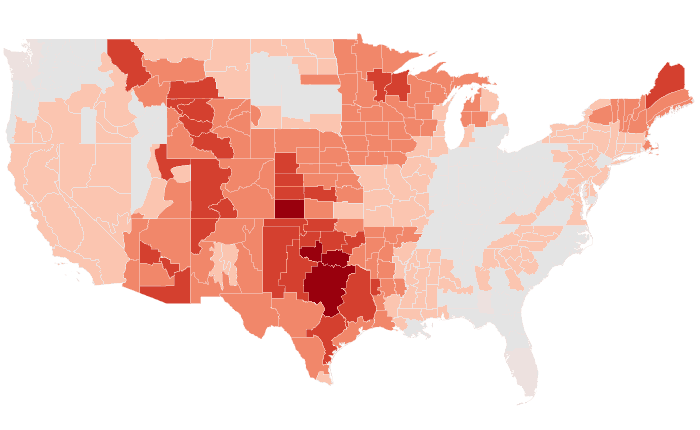

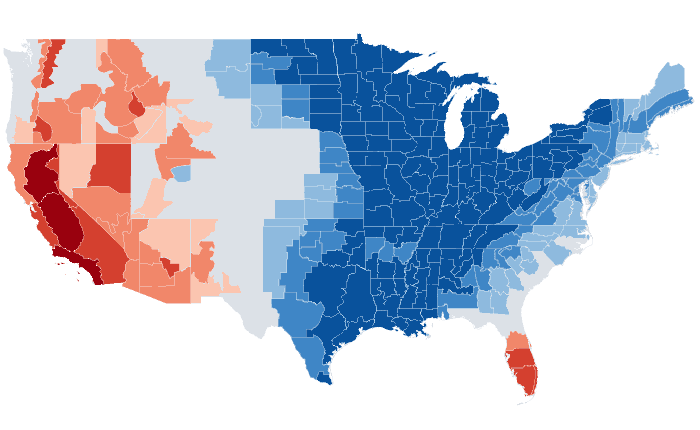
Outlooks
Probability of the favored tercile: 40, 50, 60, 70%+
Observed
Departure from normal: steps at ±0.5, 1, 2, 3°F
Precipitation

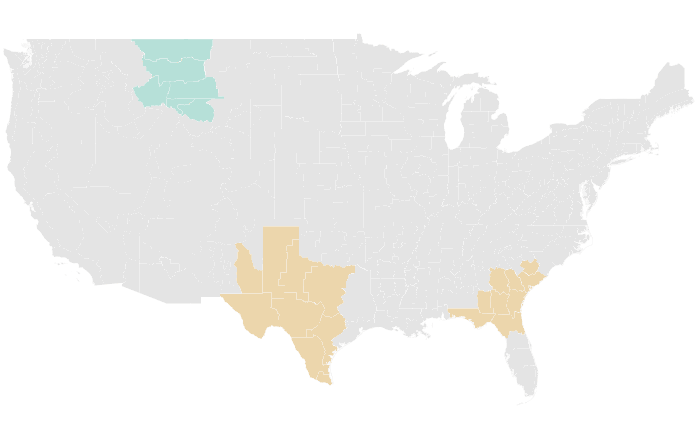

Outlooks
Probability of the favored tercile: 40, 50, 60, 70%+
Observed
Percent of normal: steps at 50, 70, 80, 90, 110, 120, 130, 150%
OND 2013 issued September 2013
Temperature: 8% accurate, opposite extreme 70% (NOAA CPC 0%, 73%)
Precipitation: 28% accurate, opposite extreme 16% (NOAA CPC 0%, 33%)
Temperature
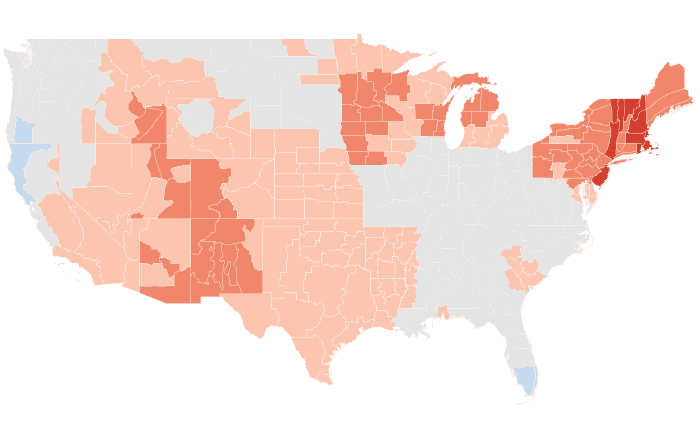

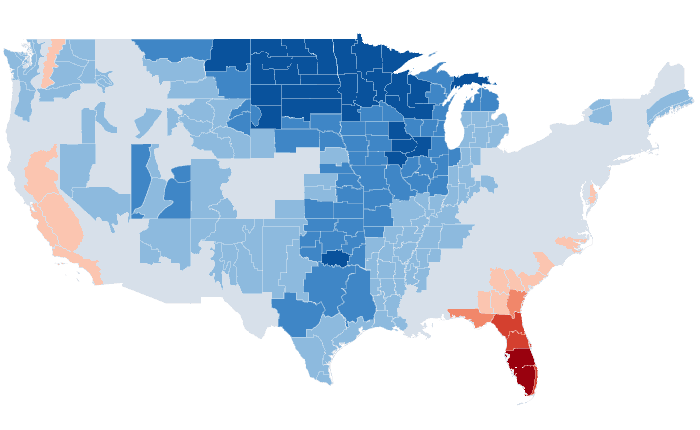
Outlooks
Probability of the favored tercile: 40, 50, 60, 70%+
Observed
Departure from normal: steps at ±0.5, 1, 2, 3°F
Precipitation
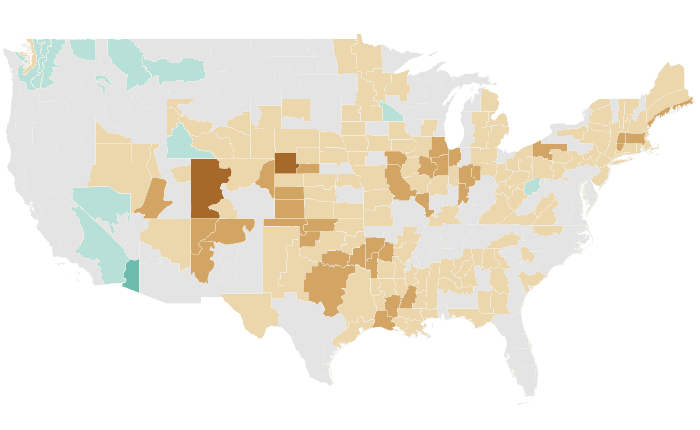

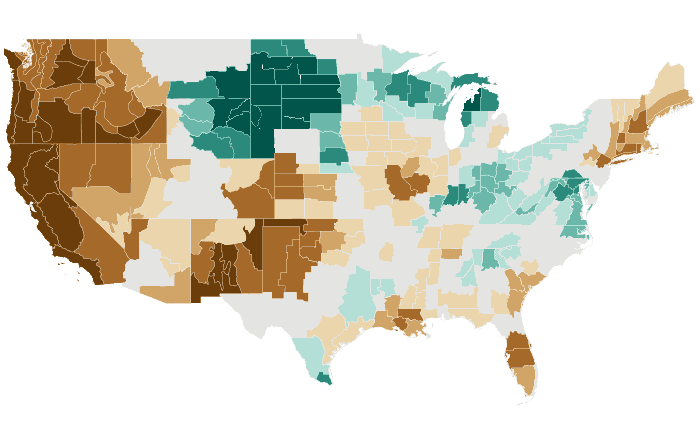
Outlooks
Probability of the favored tercile: 40, 50, 60, 70%+
Observed
Percent of normal: steps at 50, 70, 80, 90, 110, 120, 130, 150%
SON 2013 issued August 2013
Temperature: 12% accurate, opposite extreme 14% (NOAA CPC 4%, 22%)
Precipitation: 33% accurate, opposite extreme 29% (NOAA CPC 8%, 49%)
Temperature
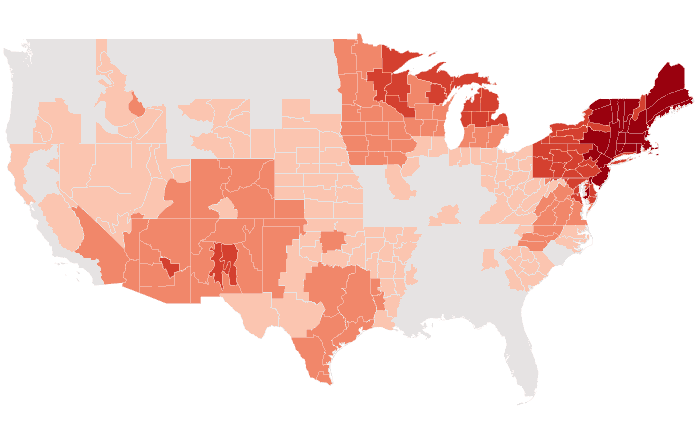
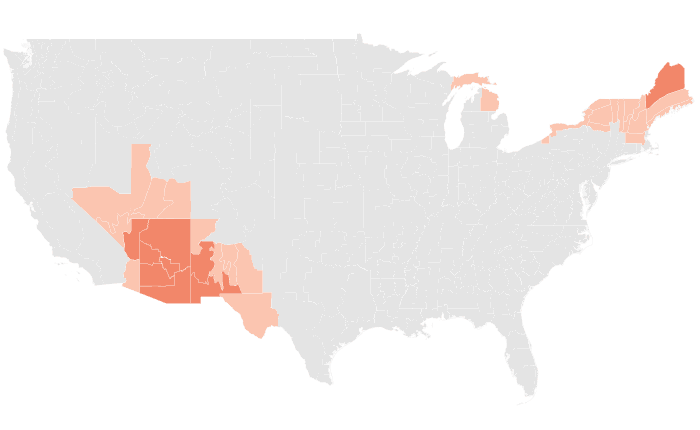
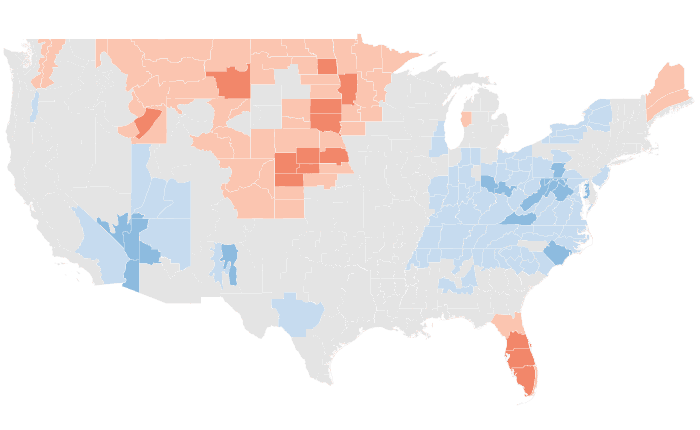
Outlooks
Probability of the favored tercile: 40, 50, 60, 70%+
Observed
Departure from normal: steps at ±0.5, 1, 2, 3°F
Precipitation
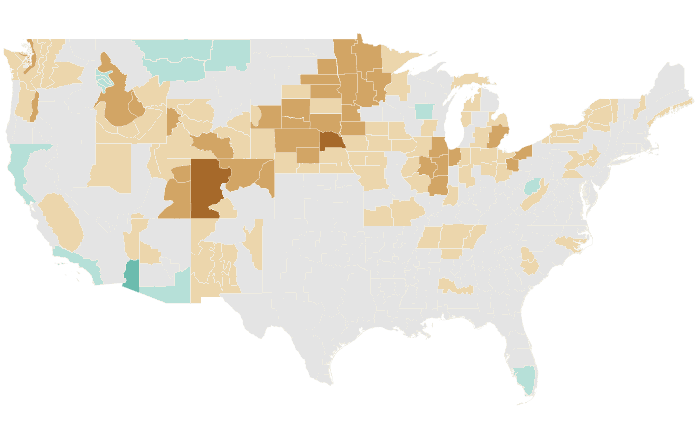


Outlooks
Probability of the favored tercile: 40, 50, 60, 70%+
Observed
Percent of normal: steps at 50, 70, 80, 90, 110, 120, 130, 150%
ASO 2013 issued July 2013
Temperature: 50% accurate, opposite extreme 18% (NOAA CPC 44%, 30%)
Precipitation: 32% accurate, opposite extreme 38% (NOAA CPC 11%, 22%)
Temperature
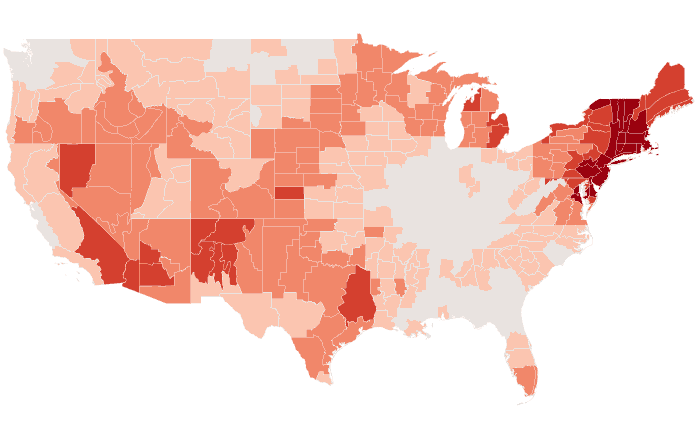
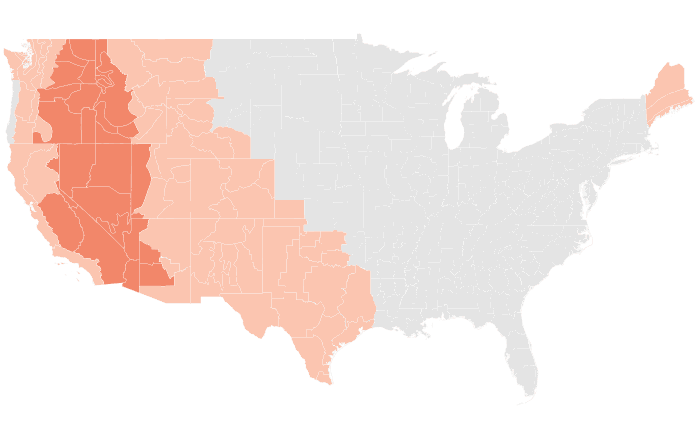
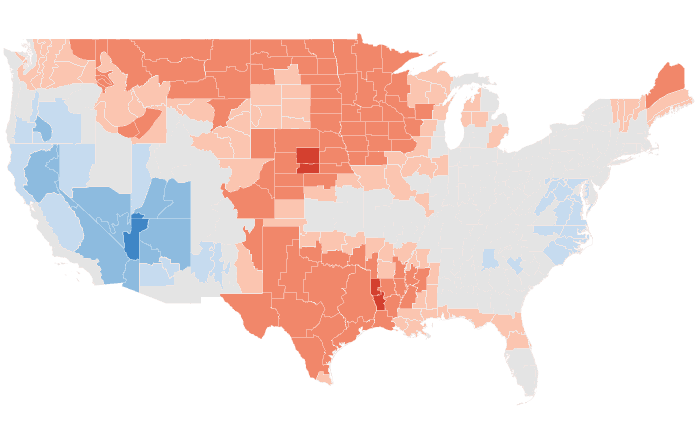
Outlooks
Probability of the favored tercile: 40, 50, 60, 70%+
Observed
Departure from normal: steps at ±0.5, 1, 2, 3°F
Precipitation

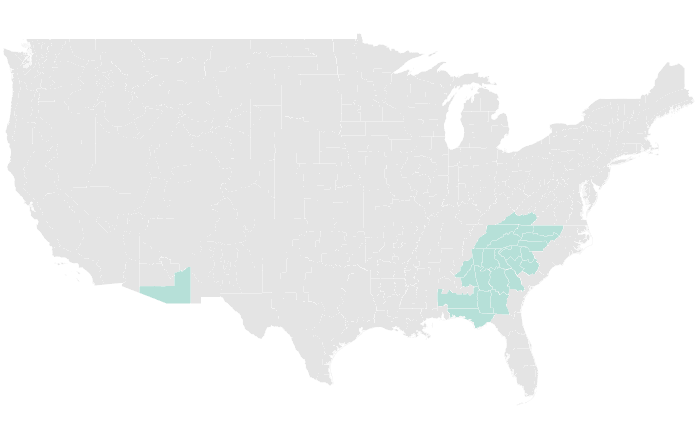

Outlooks
Probability of the favored tercile: 40, 50, 60, 70%+
Observed
Percent of normal: steps at 50, 70, 80, 90, 110, 120, 130, 150%
JAS 2013 issued June 2013
Temperature: 62% accurate, opposite extreme 3% (NOAA CPC 69%, 1%)
Precipitation: 41% accurate, opposite extreme 37% (NOAA CPC 24%, 53%)
Temperature
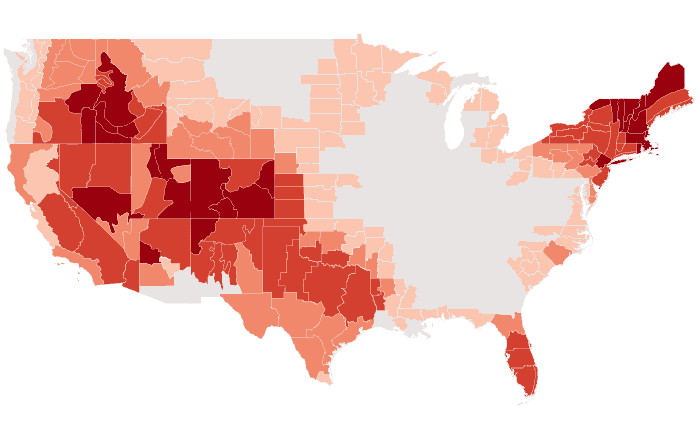


Outlooks
Probability of the favored tercile: 40, 50, 60, 70%+
Observed
Departure from normal: steps at ±0.5, 1, 2, 3°F
Precipitation

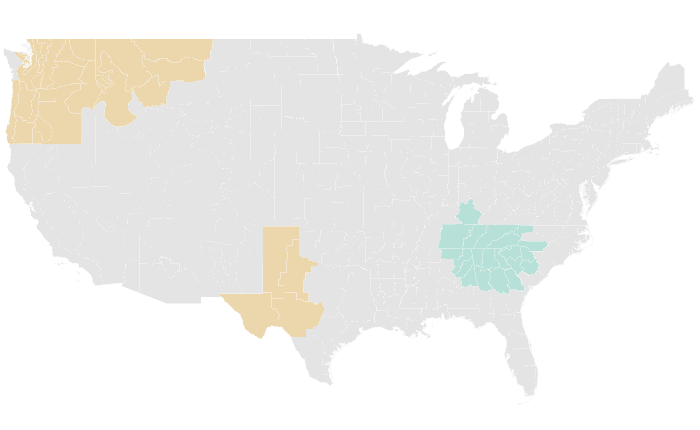

Outlooks
Probability of the favored tercile: 40, 50, 60, 70%+
Observed
Percent of normal: steps at 50, 70, 80, 90, 110, 120, 130, 150%
JJA 2013 issued May 2013
Temperature: 59% accurate, opposite extreme 19% (NOAA CPC 76%, 4%)
Precipitation: 43% accurate, opposite extreme 22% (NOAA CPC 36%, 18%)
Temperature


Outlooks
Probability of the favored tercile: 40, 50, 60, 70%+
Observed
Departure from normal: steps at ±0.5, 1, 2, 3°F
Precipitation
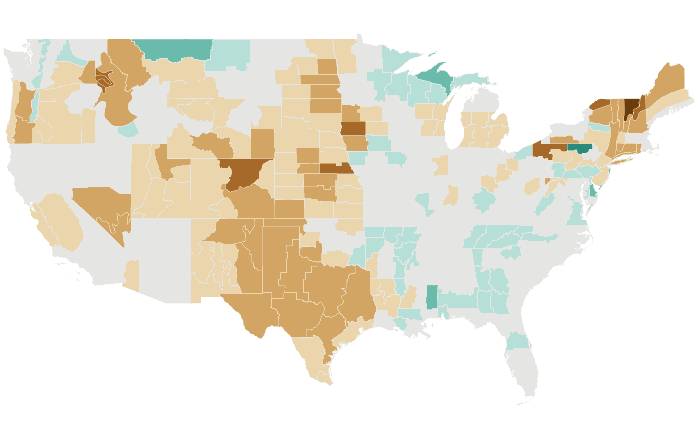

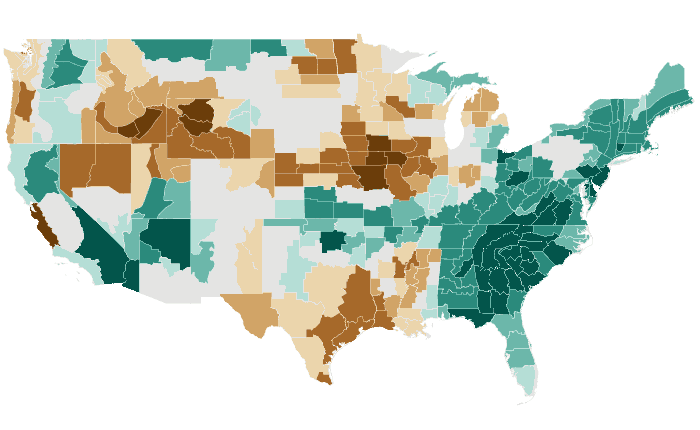
Outlooks
Probability of the favored tercile: 40, 50, 60, 70%+
Observed
Percent of normal: steps at 50, 70, 80, 90, 110, 120, 130, 150%
MJJ 2013 issued April 2013
Temperature: 50% accurate, opposite extreme 25% (NOAA CPC 40%, 36%)
Precipitation: 32% accurate, opposite extreme 30% (NOAA CPC 52%, 0%)
Temperature

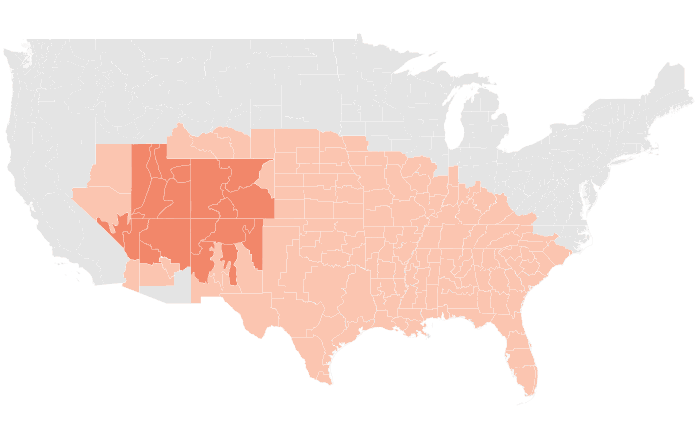

Outlooks
Probability of the favored tercile: 40, 50, 60, 70%+
Observed
Departure from normal: steps at ±0.5, 1, 2, 3°F
Precipitation
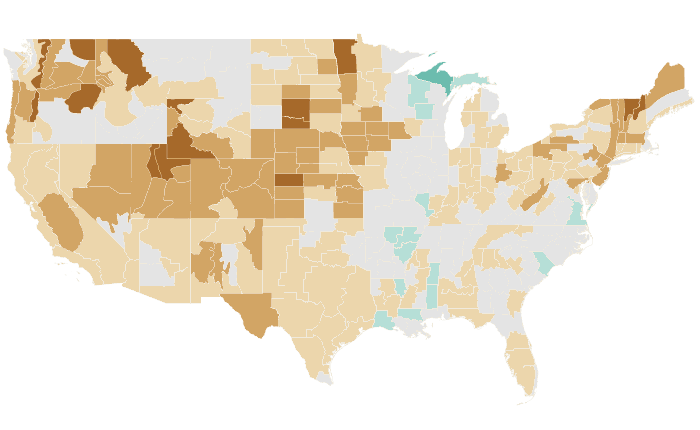


Outlooks
Probability of the favored tercile: 40, 50, 60, 70%+
Observed
Percent of normal: steps at 50, 70, 80, 90, 110, 120, 130, 150%
AMJ 2013 issued March 2013
Temperature: 26% accurate, opposite extreme 37% (NOAA CPC 20%, 36%)
Precipitation: 56% accurate, opposite extreme 10% (NOAA CPC 77%, 2%)
Temperature
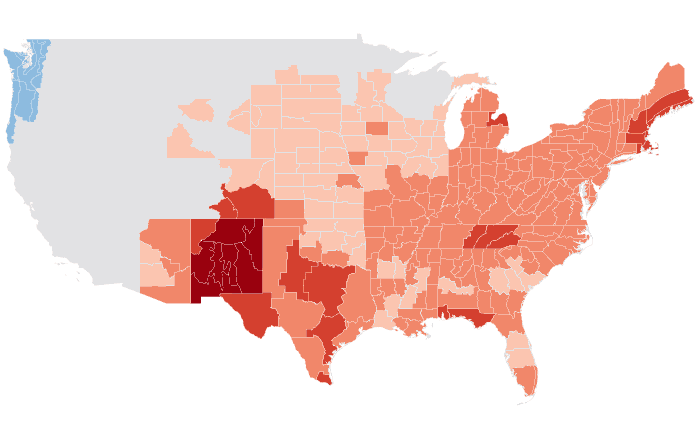


Outlooks
Probability of the favored tercile: 40, 50, 60, 70%+
Observed
Departure from normal: steps at ±0.5, 1, 2, 3°F
Precipitation
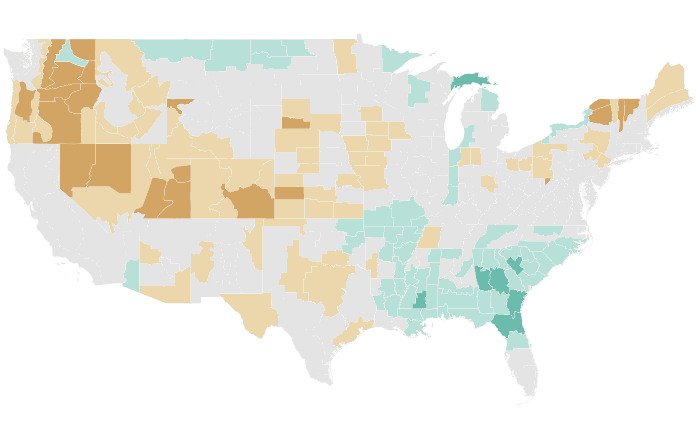

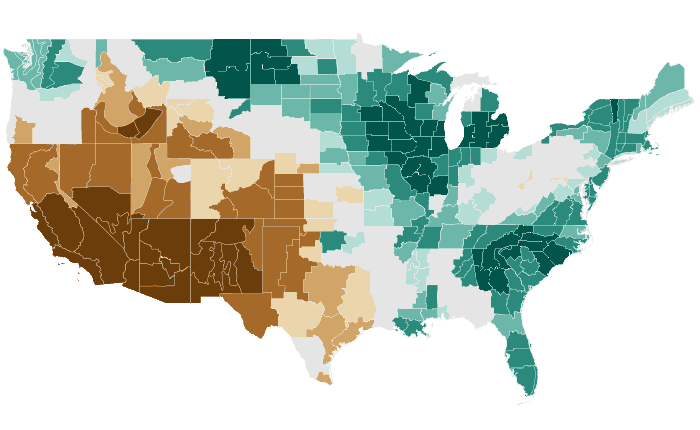
Outlooks
Probability of the favored tercile: 40, 50, 60, 70%+
Observed
Percent of normal: steps at 50, 70, 80, 90, 110, 120, 130, 150%
MAM 2013 issued February 2013
Temperature: 8% accurate, opposite extreme 61% (NOAA CPC 6%, 63%)
Precipitation: 57% accurate, opposite extreme 14% (NOAA CPC 88%, 2%)
Temperature
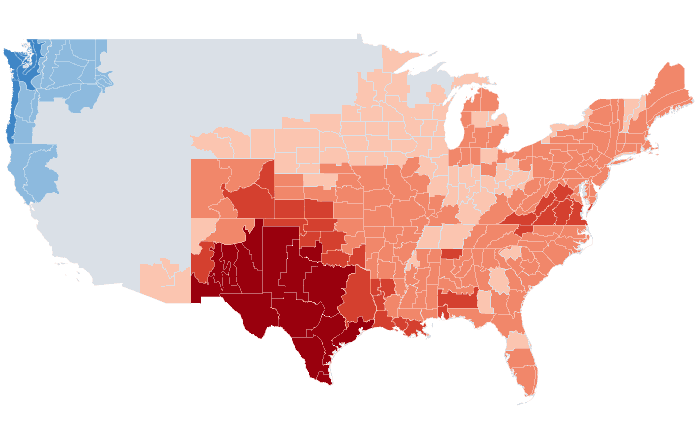
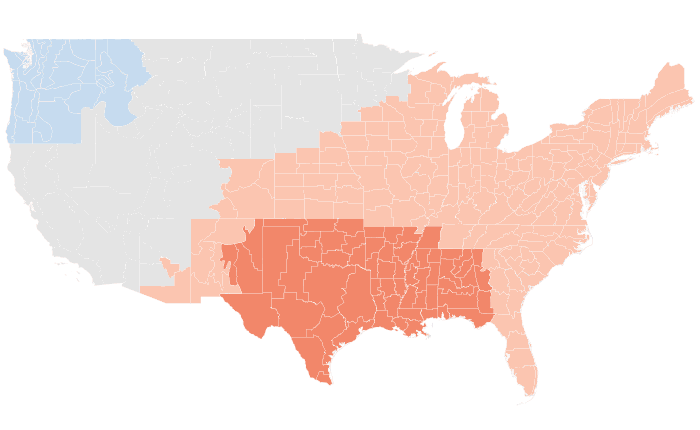

Outlooks
Probability of the favored tercile: 40, 50, 60, 70%+
Observed
Departure from normal: steps at ±0.5, 1, 2, 3°F
Precipitation

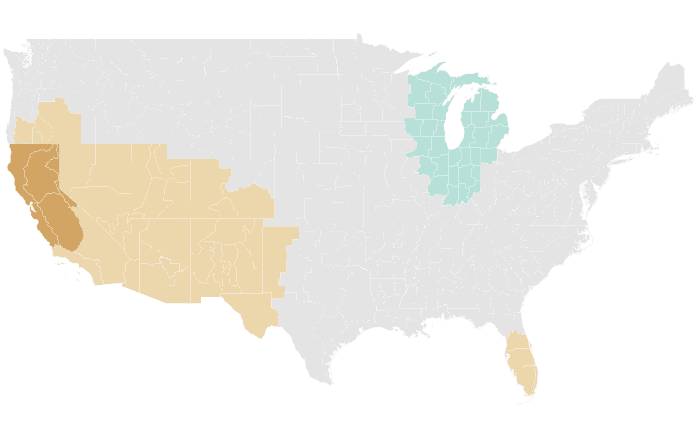

Outlooks
Probability of the favored tercile: 40, 50, 60, 70%+
Observed
Percent of normal: steps at 50, 70, 80, 90, 110, 120, 130, 150%
FMA 2013 issued January 2013
Temperature: 5% accurate, opposite extreme 72% (NOAA CPC 16%, 39%)
Precipitation: 51% accurate, opposite extreme 22% (NOAA CPC 89%, 10%)
Temperature


Outlooks
Probability of the favored tercile: 40, 50, 60, 70%+
Observed
Departure from normal: steps at ±0.5, 1, 2, 3°F
Precipitation
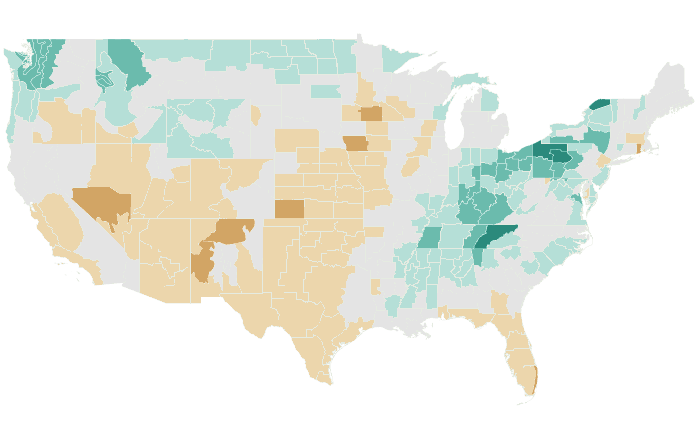
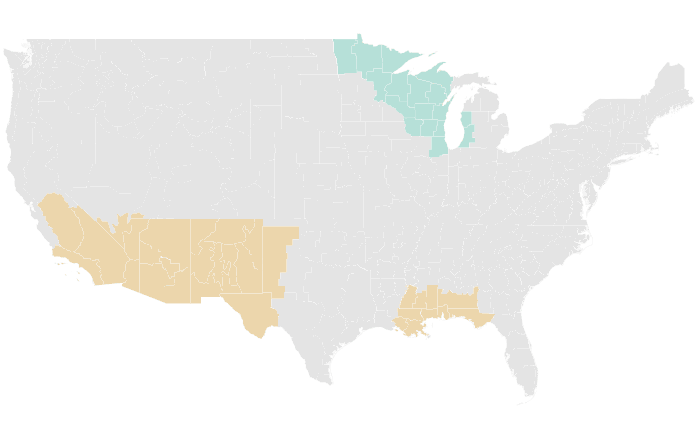
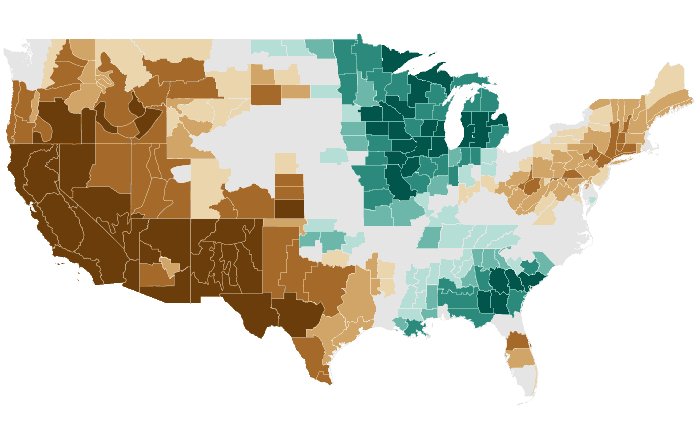
Outlooks
Probability of the favored tercile: 40, 50, 60, 70%+
Observed
Percent of normal: steps at 50, 70, 80, 90, 110, 120, 130, 150%
JFM 2013 issued December 2012
Temperature: 10% accurate, opposite extreme 39% (NOAA CPC 18%, 30%)
Precipitation: 49% accurate, opposite extreme 21% (NOAA CPC 63%, 14%)
Temperature


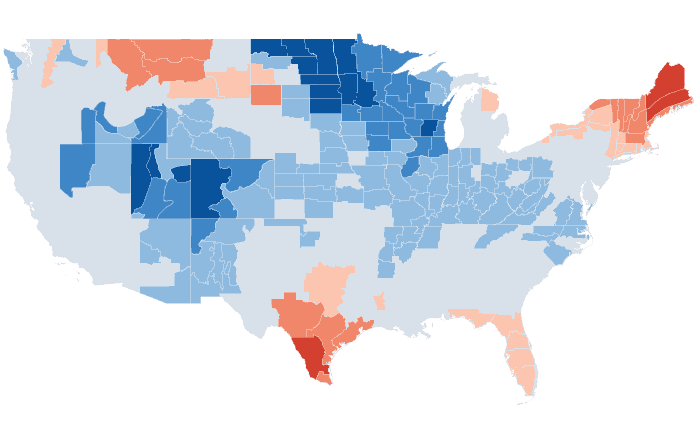
Outlooks
Probability of the favored tercile: 40, 50, 60, 70%+
Observed
Departure from normal: steps at ±0.5, 1, 2, 3°F
Precipitation

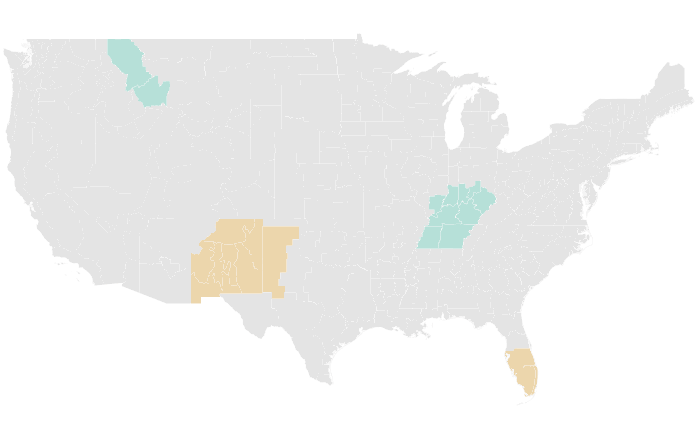

Outlooks
Probability of the favored tercile: 40, 50, 60, 70%+
Observed
Percent of normal: steps at 50, 70, 80, 90, 110, 120, 130, 150%
DJF 2012-13 issued November 2012
Temperature: 36% accurate, opposite extreme 35% (NOAA CPC 25%, 50%)
Precipitation: 41% accurate, opposite extreme 21% (NOAA CPC 97%, 0%)
Temperature
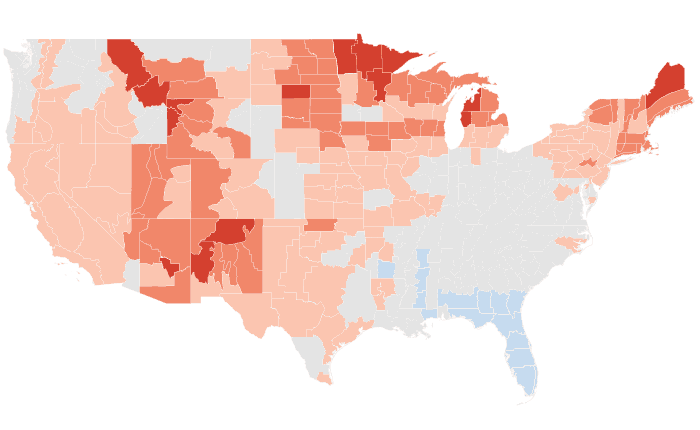


Outlooks
Probability of the favored tercile: 40, 50, 60, 70%+
Observed
Departure from normal: steps at ±0.5, 1, 2, 3°F
Precipitation
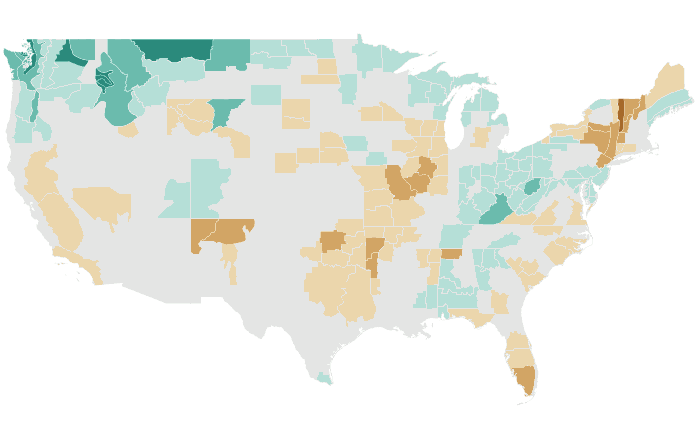


Outlooks
Probability of the favored tercile: 40, 50, 60, 70%+
Observed
Percent of normal: steps at 50, 70, 80, 90, 110, 120, 130, 150%
NDJ 2012-13 issued October 2012
Temperature: 51% accurate, opposite extreme 12% (NOAA CPC 7%, 25%)
Precipitation: 44% accurate, opposite extreme 6% (NOAA CPC 18%, 17%)
Temperature
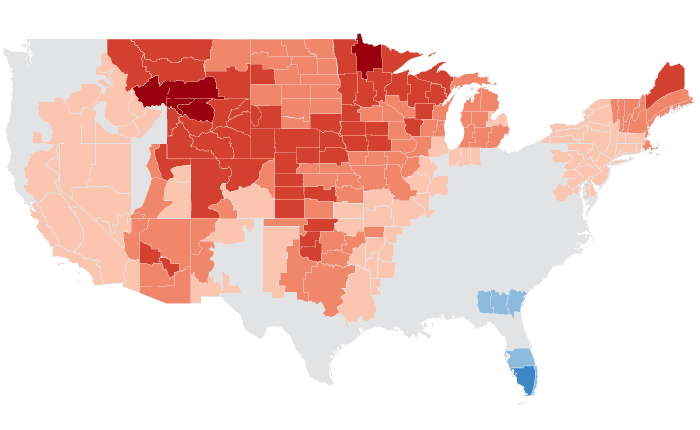
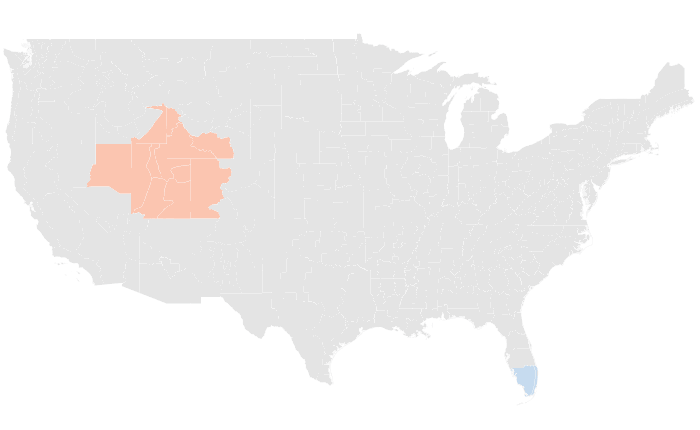

Outlooks
Probability of the favored tercile: 40, 50, 60, 70%+
Observed
Departure from normal: steps at ±0.5, 1, 2, 3°F
Precipitation
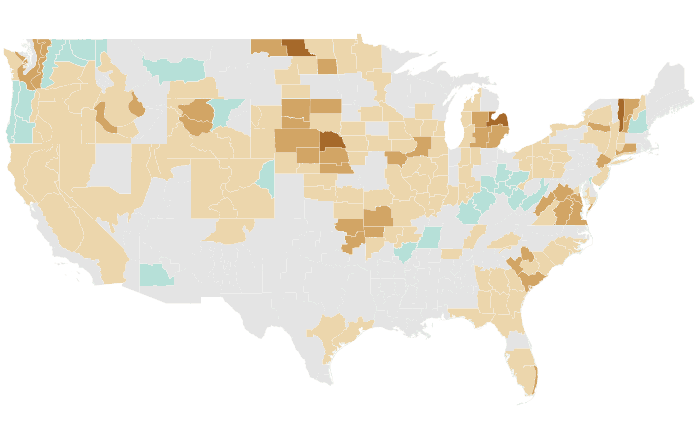

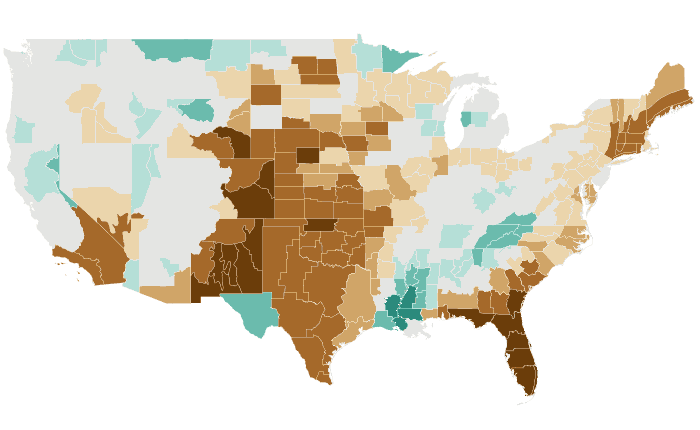
Outlooks
Probability of the favored tercile: 40, 50, 60, 70%+
Observed
Percent of normal: steps at 50, 70, 80, 90, 110, 120, 130, 150%
OND 2012 issued September 2012
Temperature: 70% accurate, opposite extreme 2% (NOAA CPC 62%, 0%)
Precipitation: 48% accurate, opposite extreme 9% (NOAA CPC 0%, 83%)
Temperature
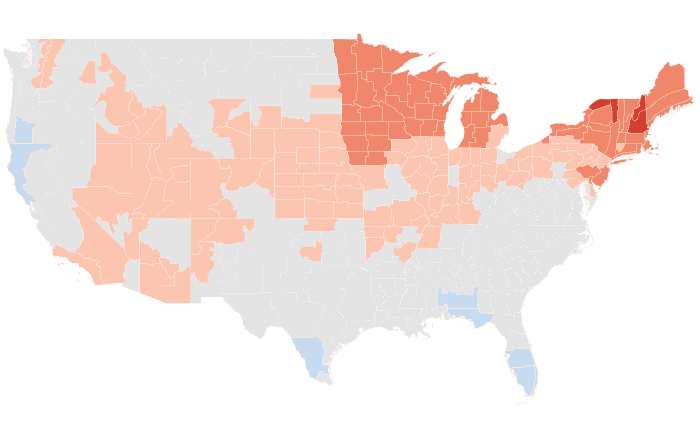

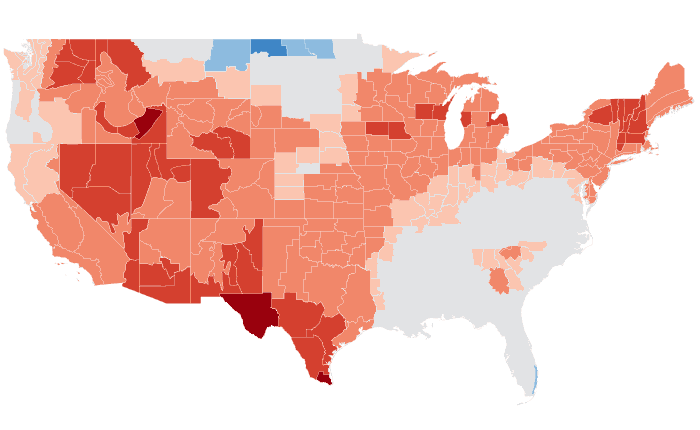
Outlooks
Probability of the favored tercile: 40, 50, 60, 70%+
Observed
Departure from normal: steps at ±0.5, 1, 2, 3°F
Precipitation


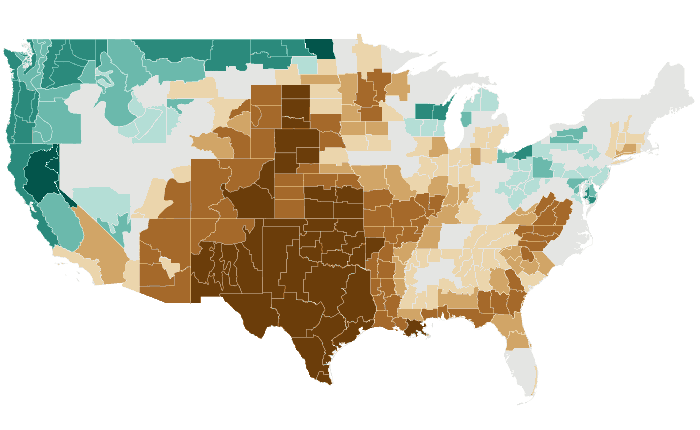
Outlooks
Probability of the favored tercile: 40, 50, 60, 70%+
Observed
Percent of normal: steps at 50, 70, 80, 90, 110, 120, 130, 150%
SON 2012 issued August 2012
Temperature: 51% accurate, opposite extreme 20% (NOAA CPC 39%, 14%)
Precipitation: 47% accurate, opposite extreme 17% (NOAA CPC 0%, 66%)
Temperature
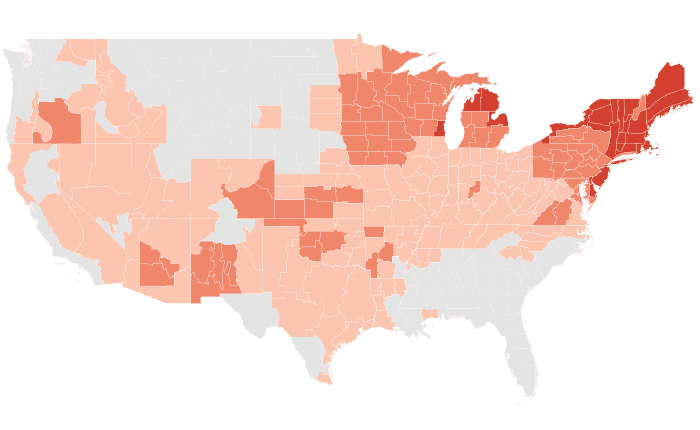
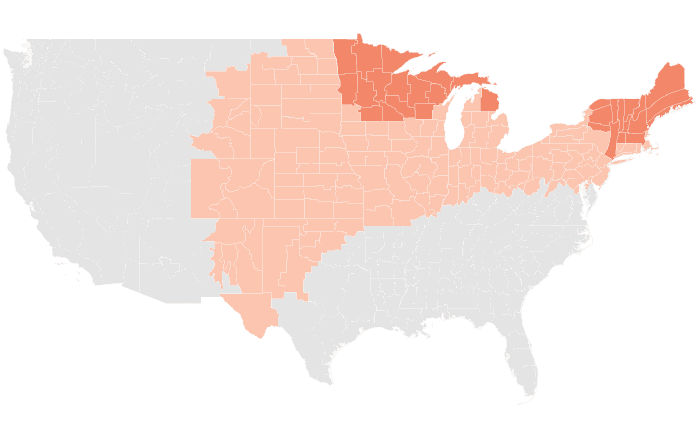
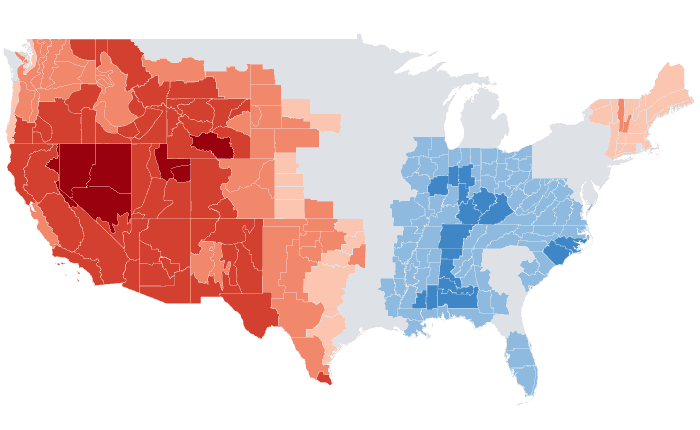
Outlooks
Probability of the favored tercile: 40, 50, 60, 70%+
Observed
Departure from normal: steps at ±0.5, 1, 2, 3°F
Precipitation
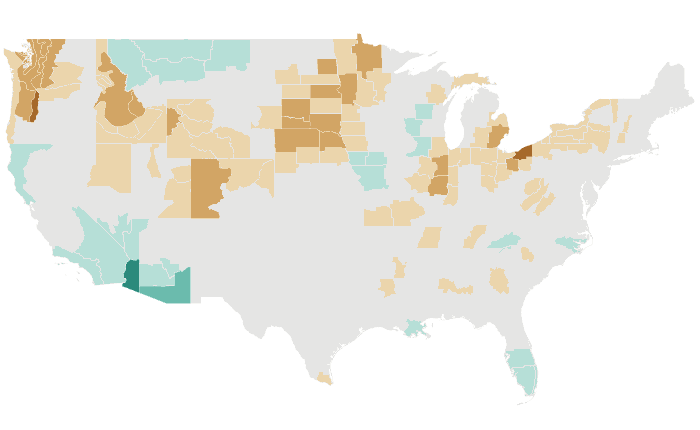
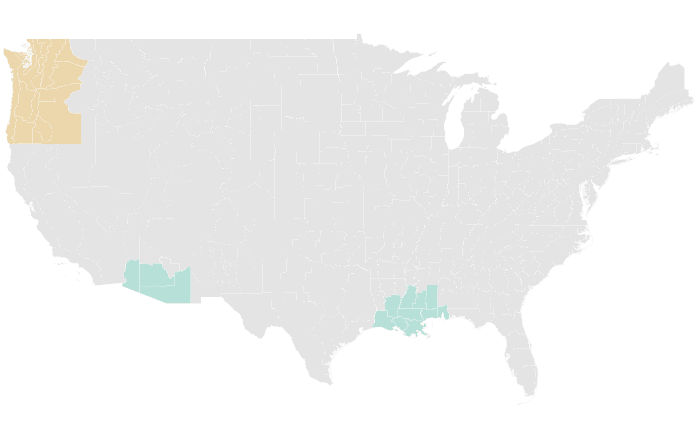

Outlooks
Probability of the favored tercile: 40, 50, 60, 70%+
Observed
Percent of normal: steps at 50, 70, 80, 90, 110, 120, 130, 150%
ASO 2012 issued July 2012
Temperature: 53% accurate, opposite extreme 18% (NOAA CPC 30%, 30%)
Precipitation: 67% accurate, opposite extreme 13% (NOAA CPC 31%, 55%)
Temperature
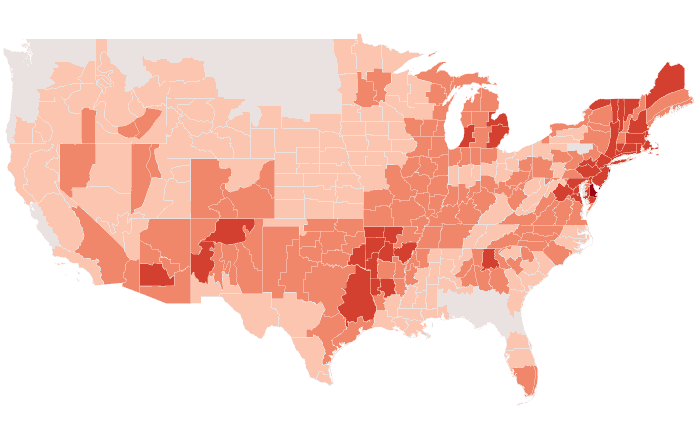
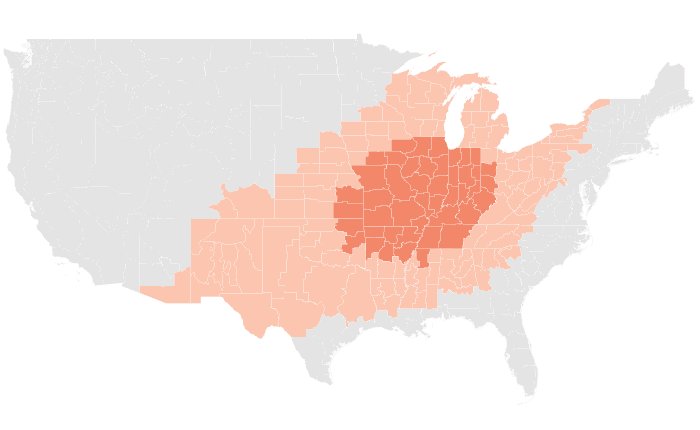
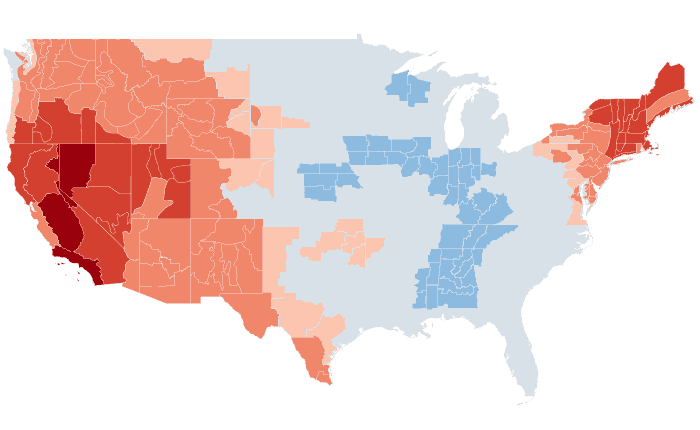
Outlooks
Probability of the favored tercile: 40, 50, 60, 70%+
Observed
Departure from normal: steps at ±0.5, 1, 2, 3°F
Precipitation
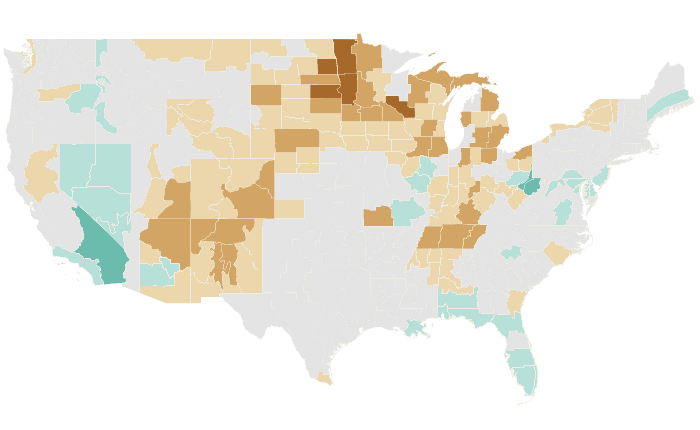


Outlooks
Probability of the favored tercile: 40, 50, 60, 70%+
Observed
Percent of normal: steps at 50, 70, 80, 90, 110, 120, 130, 150%
JAS 2012 issued June 2012
Temperature: 88% accurate, opposite extreme 0% (NOAA CPC 84%, 0%)
Precipitation: 66% accurate, opposite extreme 11% (NOAA CPC 85%, 7%)
Temperature
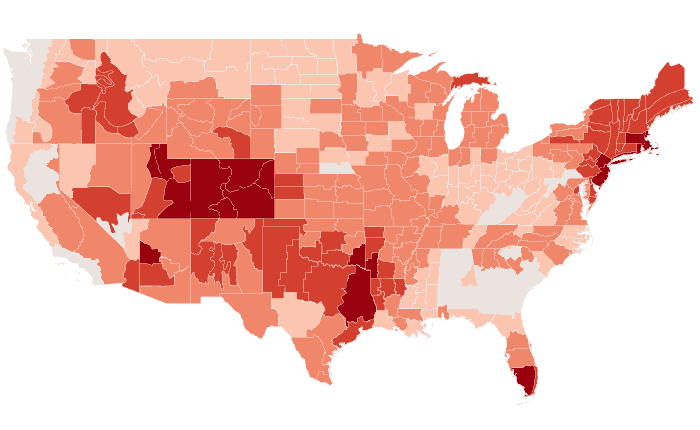


Outlooks
Probability of the favored tercile: 40, 50, 60, 70%+
Observed
Departure from normal: steps at ±0.5, 1, 2, 3°F
Precipitation
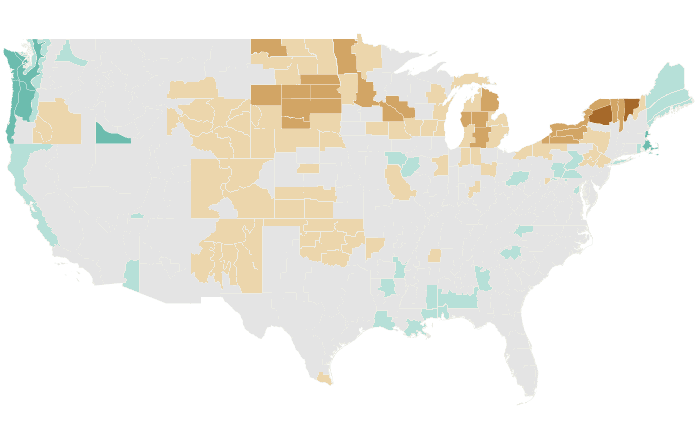

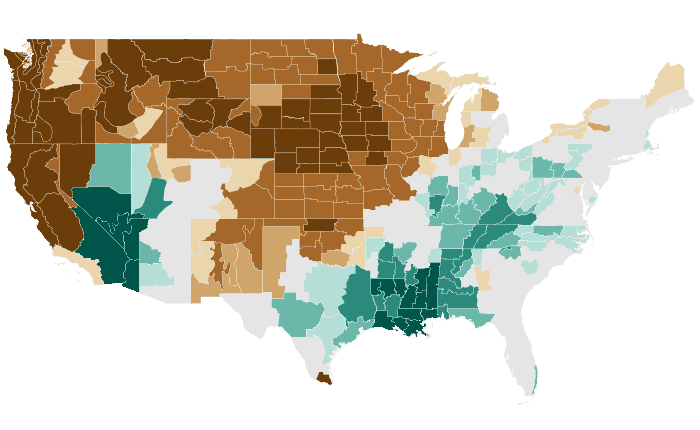
Outlooks
Probability of the favored tercile: 40, 50, 60, 70%+
Observed
Percent of normal: steps at 50, 70, 80, 90, 110, 120, 130, 150%
JJA 2012 issued May 2012
Temperature: 75% accurate, opposite extreme 2% (NOAA CPC 75%, 4%)
Precipitation: 71% accurate, opposite extreme 12% (NOAA CPC 28%, 25%)
Temperature


Outlooks
Probability of the favored tercile: 40, 50, 60, 70%+
Observed
Departure from normal: steps at ±0.5, 1, 2, 3°F
Precipitation
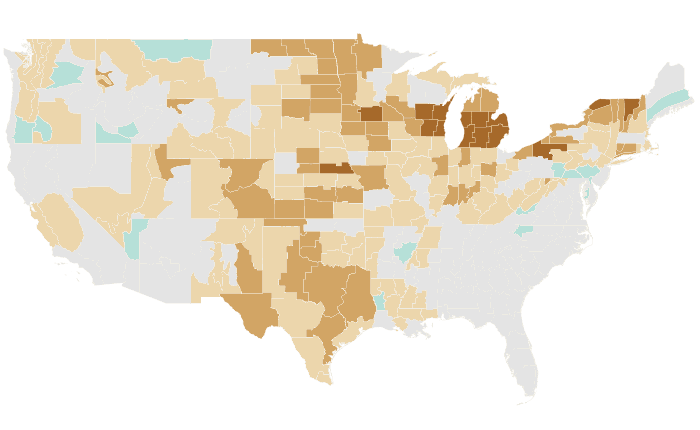


Outlooks
Probability of the favored tercile: 40, 50, 60, 70%+
Observed
Percent of normal: steps at 50, 70, 80, 90, 110, 120, 130, 150%
MJJ 2012 issued April 2012
Temperature: 90% accurate, opposite extreme 0% (NOAA CPC 88%, 7%)
Precipitation: 59% accurate, opposite extreme 17% (NOAA CPC 45%, 25%)
Temperature
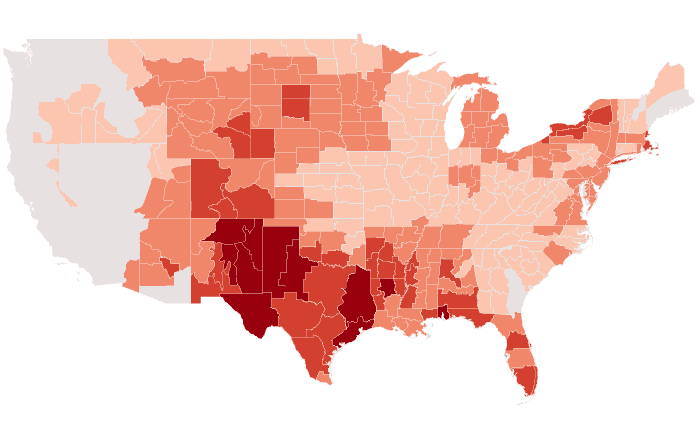


Outlooks
Probability of the favored tercile: 40, 50, 60, 70%+
Observed
Departure from normal: steps at ±0.5, 1, 2, 3°F
Precipitation
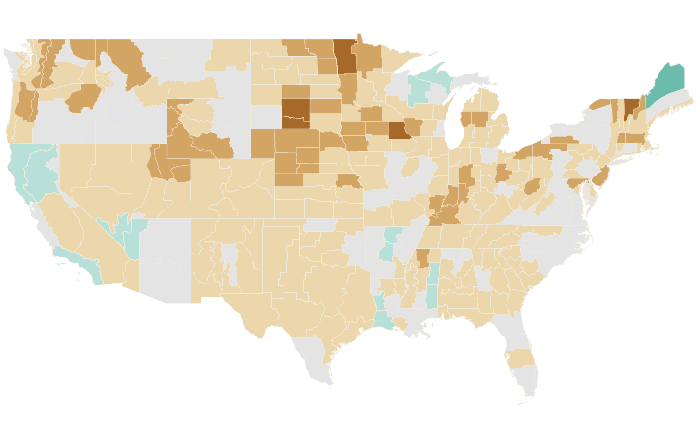
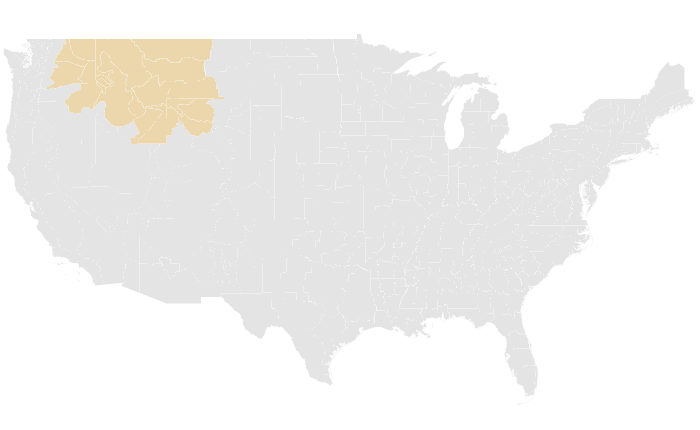

Outlooks
Probability of the favored tercile: 40, 50, 60, 70%+
Observed
Percent of normal: steps at 50, 70, 80, 90, 110, 120, 130, 150%
AMJ 2012 issued March 2012
Temperature: 86% accurate, opposite extreme 5% (NOAA CPC 92%, 0%)
Precipitation: 63% accurate, opposite extreme 11% (NOAA CPC 87%, 2%)
Temperature
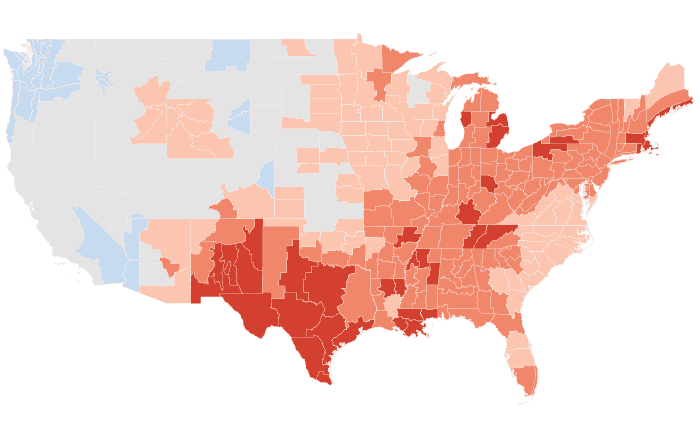


Outlooks
Probability of the favored tercile: 40, 50, 60, 70%+
Observed
Departure from normal: steps at ±0.5, 1, 2, 3°F
Precipitation
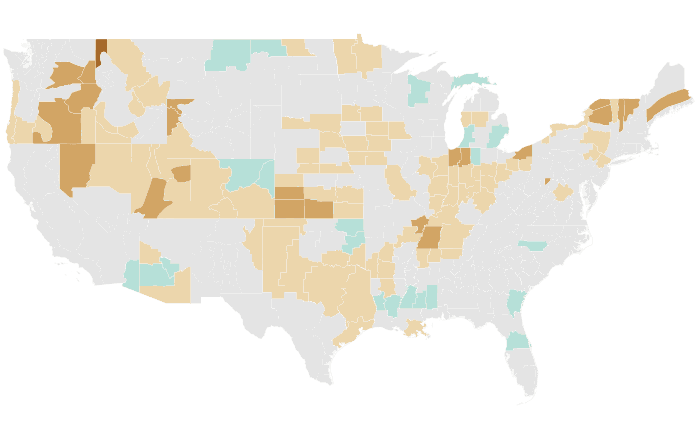


Outlooks
Probability of the favored tercile: 40, 50, 60, 70%+
Observed
Percent of normal: steps at 50, 70, 80, 90, 110, 120, 130, 150%
MAM 2012 issued February 2012
Temperature: 92% accurate, opposite extreme 2% (NOAA CPC 100%, 0%)
Precipitation: 57% accurate, opposite extreme 18% (NOAA CPC 59%, 26%)
Temperature


Outlooks
Probability of the favored tercile: 40, 50, 60, 70%+
Observed
Departure from normal: steps at ±0.5, 1, 2, 3°F
Precipitation
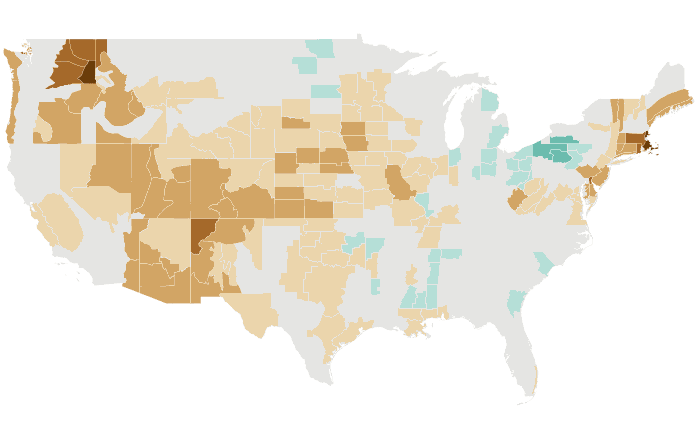

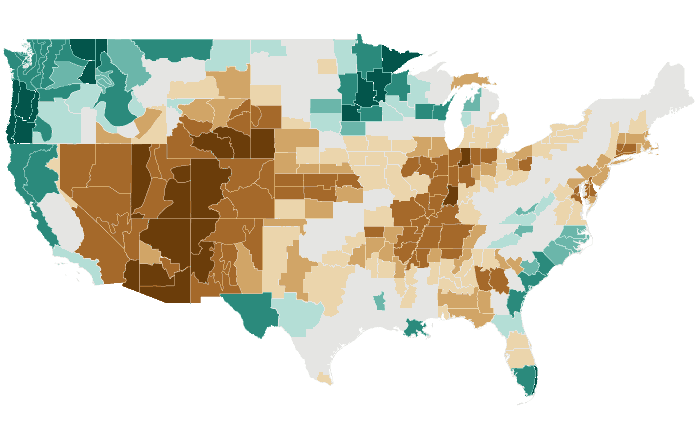
Outlooks
Probability of the favored tercile: 40, 50, 60, 70%+
Observed
Percent of normal: steps at 50, 70, 80, 90, 110, 120, 130, 150%
FMA 2012 issued January 2012
Temperature: 84% accurate, opposite extreme 4% (NOAA CPC 97%, 0%)
Precipitation: 45% accurate, opposite extreme 29% (NOAA CPC 48%, 27%)
Temperature


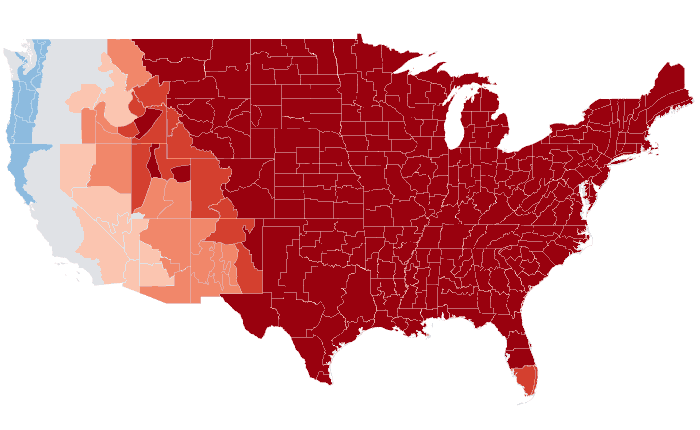
Outlooks
Probability of the favored tercile: 40, 50, 60, 70%+
Observed
Departure from normal: steps at ±0.5, 1, 2, 3°F
Precipitation
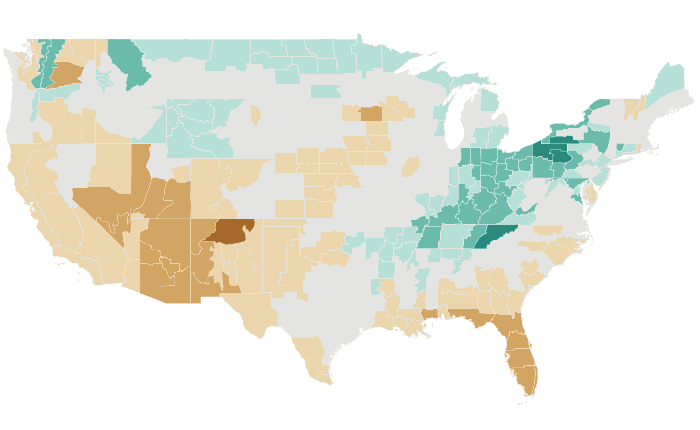
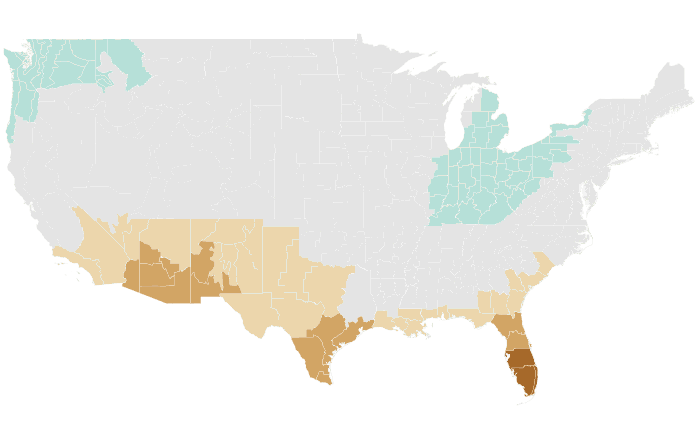

Outlooks
Probability of the favored tercile: 40, 50, 60, 70%+
Observed
Percent of normal: steps at 50, 70, 80, 90, 110, 120, 130, 150%
Outlooks issued from October 2026 on are saved, and fingerprinted, the day they are issued. Earlier seasons were produced afterwards with the same method, using only data up to each issue date. Data through August 2026.
The Amphibian Seasonal Outlook is an independent product. It is not affiliated with or endorsed by NOAA or the National Weather Service. For watches and warnings, see weather.gov.