NDJ 2026-27
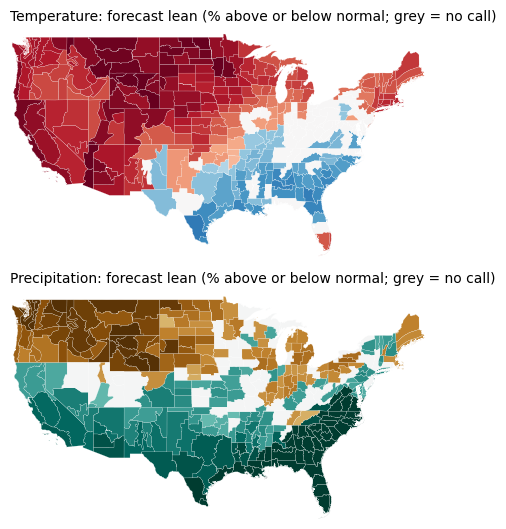
Temperature
Verification comes when the season’s observations are in.
Precipitation
Verification comes when the season’s observations are in.
Field tools
Our own three-month temperature and precipitation outlook for every climate division in the lower 48, issued monthly and checked against what actually happened. Seasonal forecasts tilt the odds rather than predict the weather, so every past outlook stays up beside its verification. Data through August 2026.
Temperature, 18 seasons
75%
of calls verified; 3% came out the opposite way
Precipitation, 18 seasons
50%
of calls verified; 18% came out the opposite way
A blind guess
33%
of calls would verify, and 33% would come out the opposite way
A call is a lean of 40% or more toward one of the three categories. Over the longer test period 2012–2025, this method verified 59% of temperature calls (13% opposite) and 49% of precipitation calls (19% opposite); the official NOAA outlook scored 59% (14%) and 45% (24%) on the same seasons and places. 2025 and 2026 were unusually warm across the country, which makes warm calls verify more often than the long-run rate.
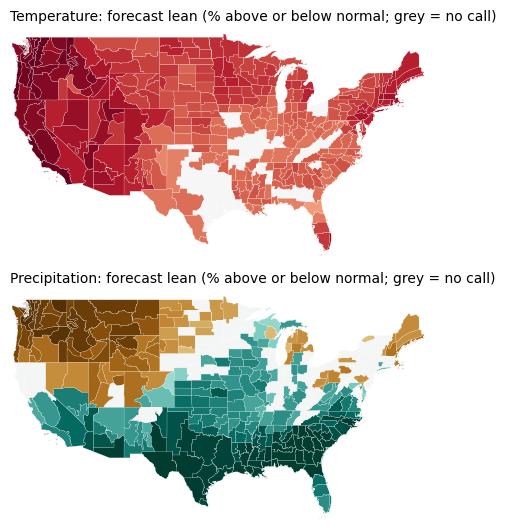
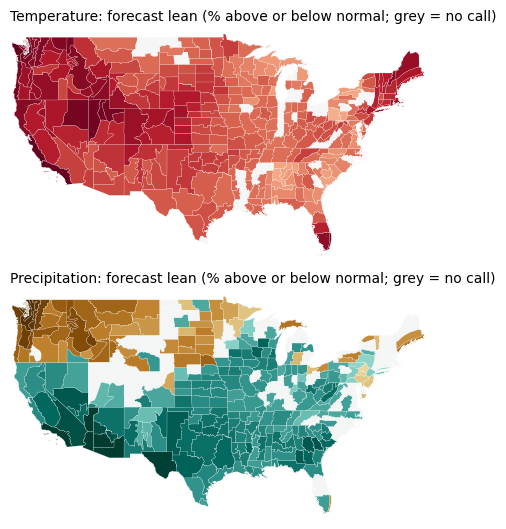
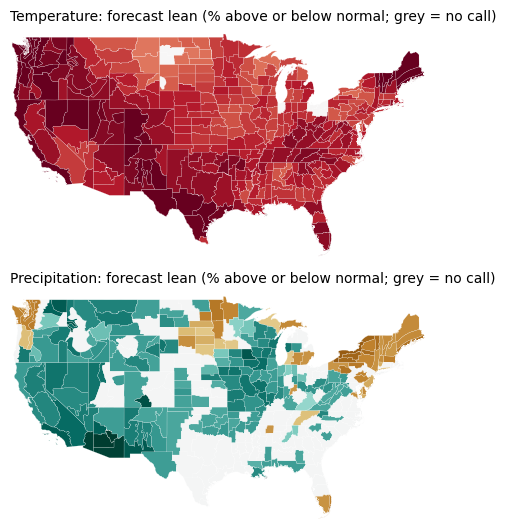
Each season is compared with the 1991–2020 normal for that place and time of year, split into thirds: below normal, near normal, above normal. The forecast map shows which way the odds lean and by how much (dark red: a strong lean toward above-normal temperature; dark brown: toward below-normal precipitation; grey: no lean). The observed map shows which third the season actually landed in. “Verified” means the favoured third happened; “opposite” means the other extreme did.
Verification comes when the season’s observations are in.
Verification comes when the season’s observations are in.
Verification comes when the season’s observations are in.
Verification comes when the season’s observations are in.
Verification comes when the season’s observations are in.
Verification comes when the season’s observations are in.
Verification comes when the season’s observations are in.
Verification comes when the season’s observations are in.
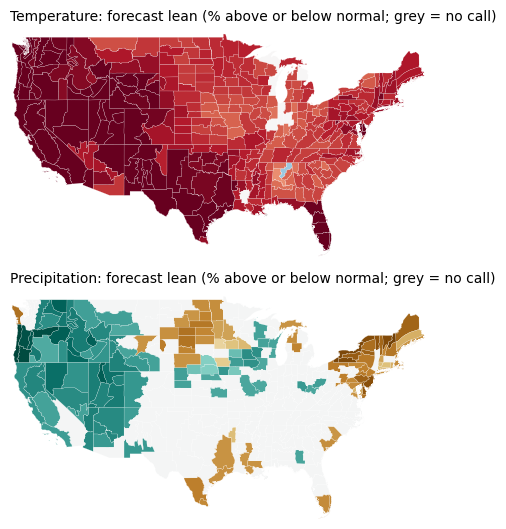
Verification comes when the season’s observations are in.
Verification comes when the season’s observations are in.
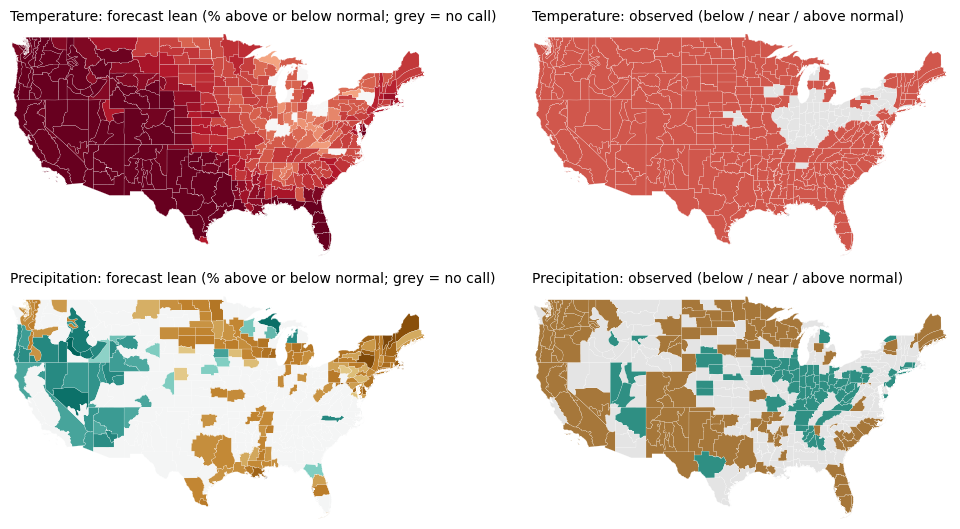
93% of calls verified · 0% came out the opposite way · calls made over 98% of the country · observed: 0% below, 9% near, 91% above normal
40% of calls verified · 20% came out the opposite way · calls made over 45% of the country · observed: 43% below, 40% near, 16% above normal
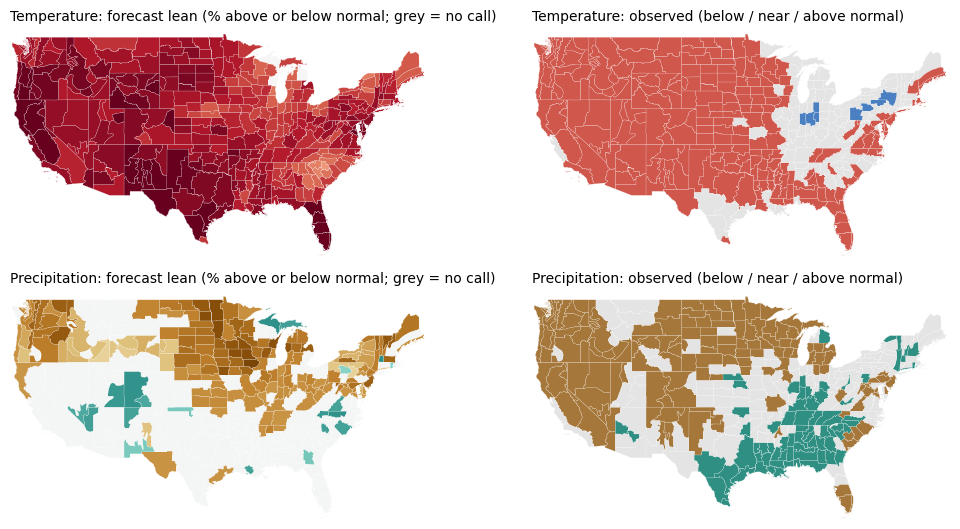
79% of calls verified · 1% came out the opposite way · calls made over 99% of the country · observed: 1% below, 21% near, 77% above normal
47% of calls verified · 17% came out the opposite way · calls made over 46% of the country · observed: 47% below, 35% near, 18% above normal
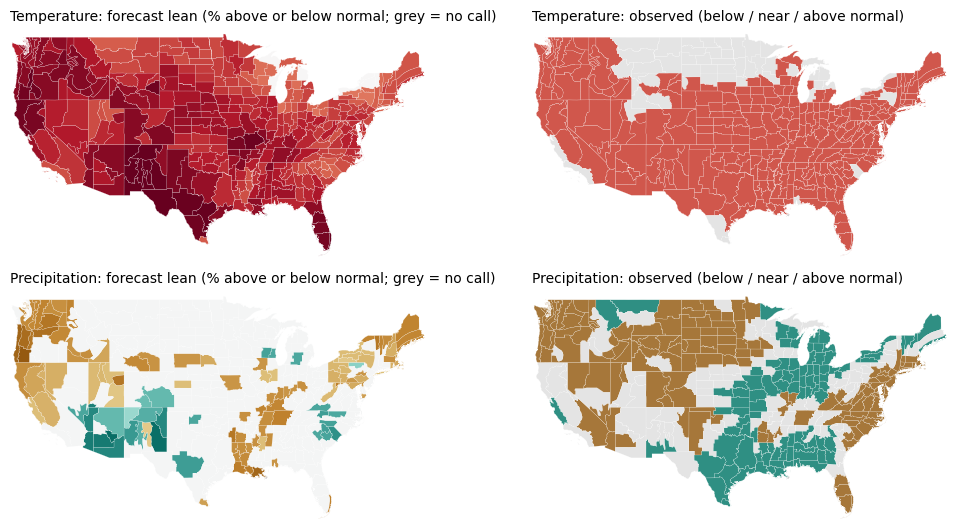
84% of calls verified · 0% came out the opposite way · calls made over 98% of the country · observed: 0% below, 17% near, 83% above normal
46% of calls verified · 21% came out the opposite way · calls made over 36% of the country · observed: 41% below, 32% near, 27% above normal
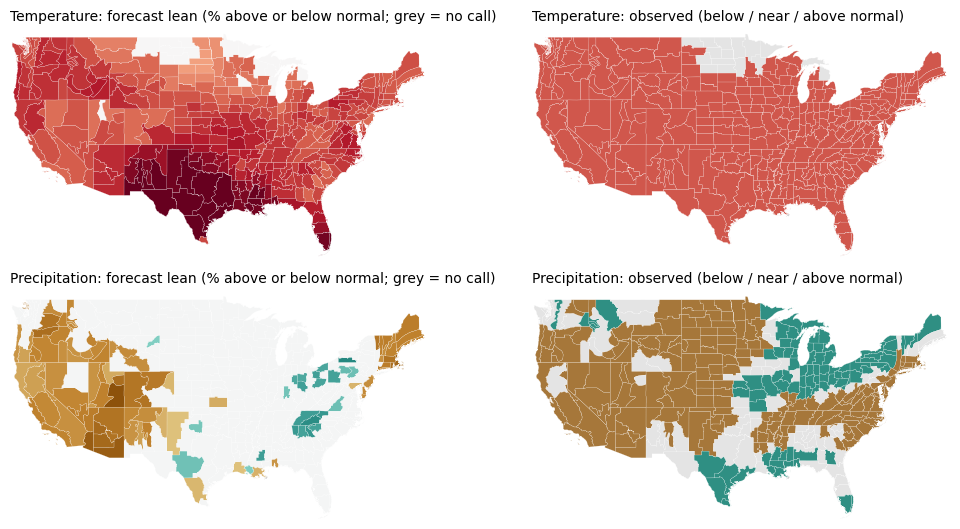
96% of calls verified · 0% came out the opposite way · calls made over 95% of the country · observed: 0% below, 5% near, 95% above normal
64% of calls verified · 6% came out the opposite way · calls made over 37% of the country · observed: 57% below, 24% near, 20% above normal
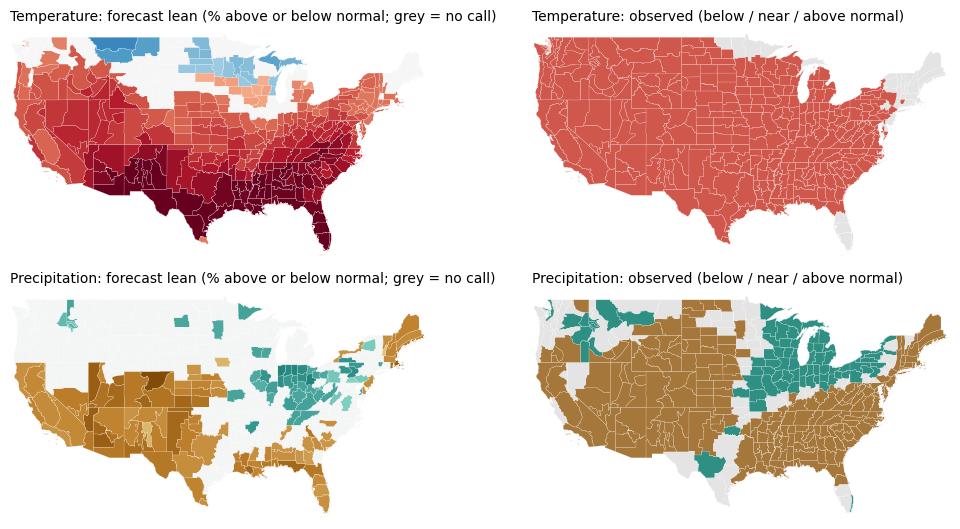
87% of calls verified · 3% came out the opposite way · calls made over 85% of the country · observed: 0% below, 6% near, 94% above normal
75% of calls verified · 10% came out the opposite way · calls made over 49% of the country · observed: 63% below, 20% near, 17% above normal
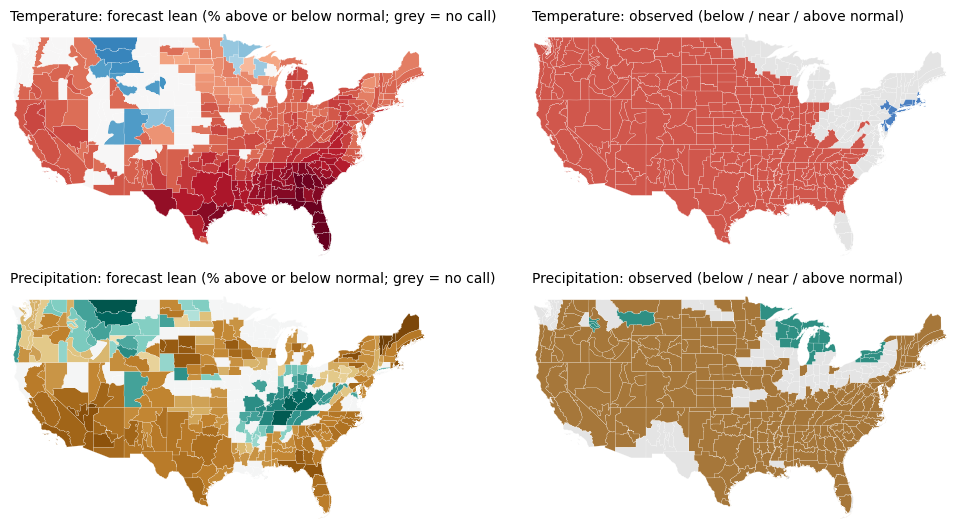
70% of calls verified · 7% came out the opposite way · calls made over 81% of the country · observed: 1% below, 15% near, 84% above normal
60% of calls verified · 12% came out the opposite way · calls made over 82% of the country · observed: 79% below, 17% near, 4% above normal
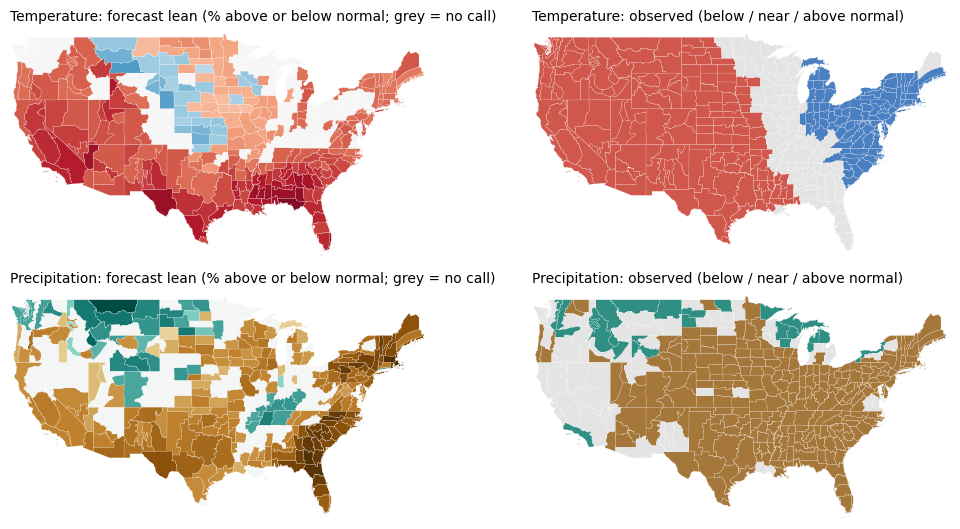
60% of calls verified · 9% came out the opposite way · calls made over 82% of the country · observed: 14% below, 20% near, 66% above normal
61% of calls verified · 12% came out the opposite way · calls made over 73% of the country · observed: 66% below, 25% near, 9% above normal
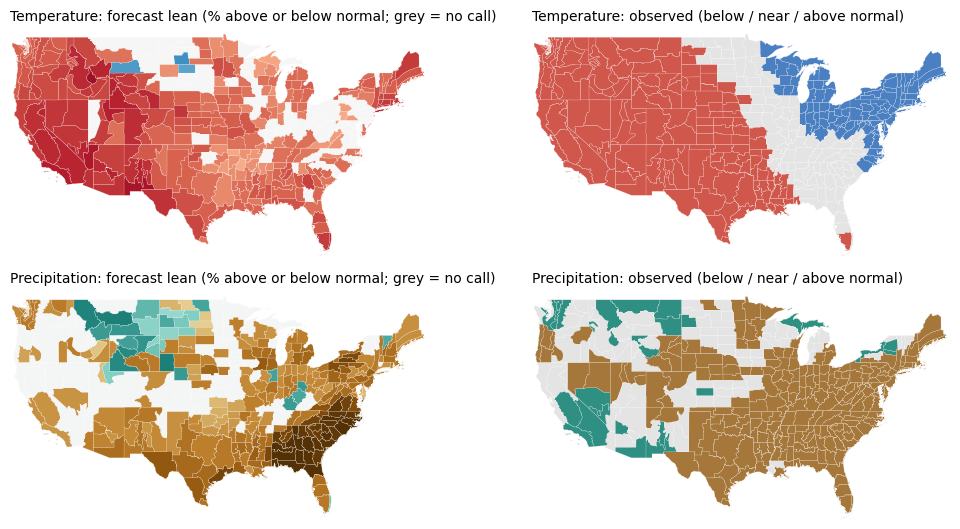
67% of calls verified · 7% came out the opposite way · calls made over 83% of the country · observed: 15% below, 22% near, 64% above normal
63% of calls verified · 11% came out the opposite way · calls made over 72% of the country · observed: 59% below, 28% near, 13% above normal
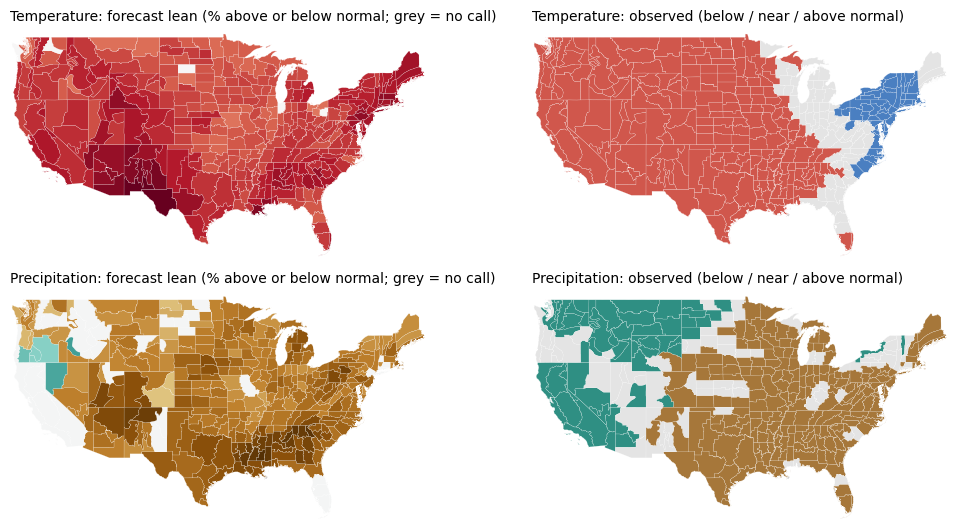
80% of calls verified · 6% came out the opposite way · calls made over 99% of the country · observed: 7% below, 14% near, 80% above normal
62% of calls verified · 14% came out the opposite way · calls made over 85% of the country · observed: 52% below, 23% near, 25% above normal
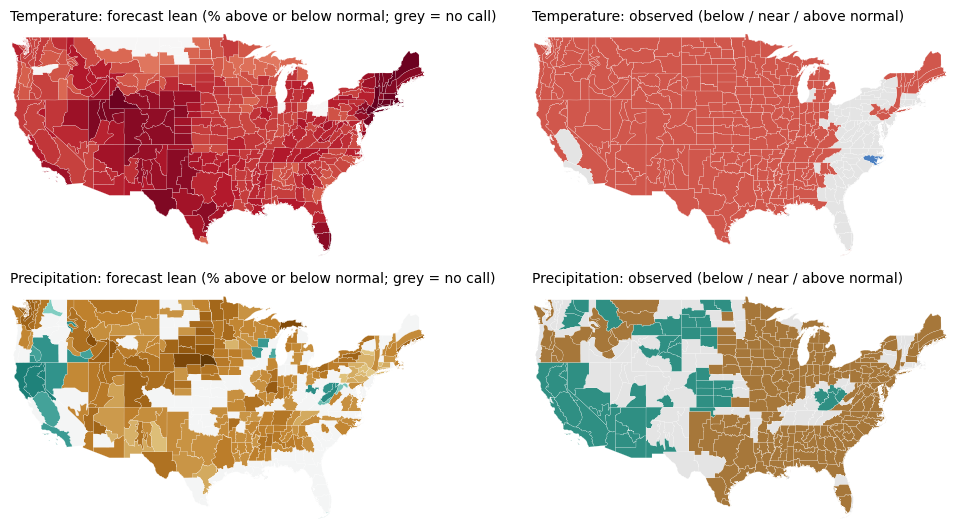
85% of calls verified · 0% came out the opposite way · calls made over 96% of the country · observed: 0% below, 13% near, 86% above normal
53% of calls verified · 14% came out the opposite way · calls made over 72% of the country · observed: 48% below, 28% near, 24% above normal
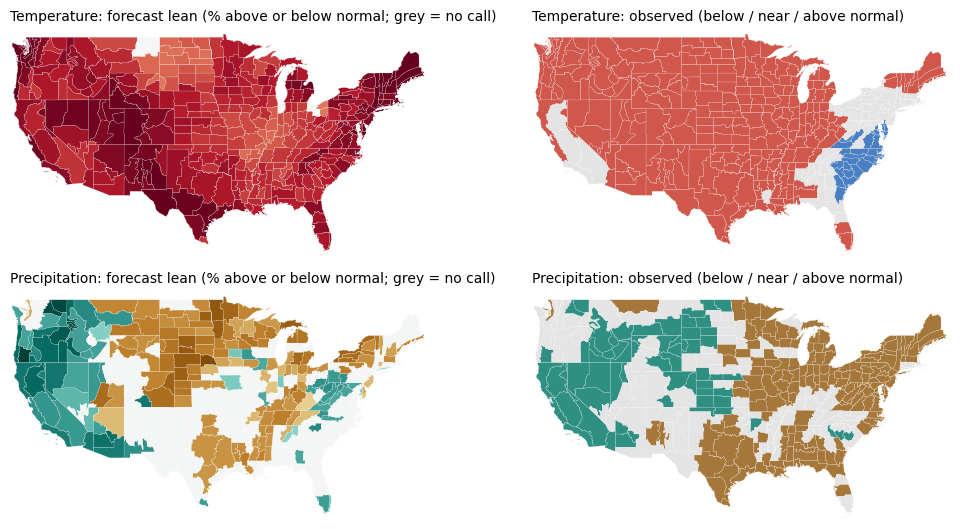
83% of calls verified · 4% came out the opposite way · calls made over 99% of the country · observed: 4% below, 13% near, 83% above normal
49% of calls verified · 16% came out the opposite way · calls made over 64% of the country · observed: 38% below, 36% near, 26% above normal
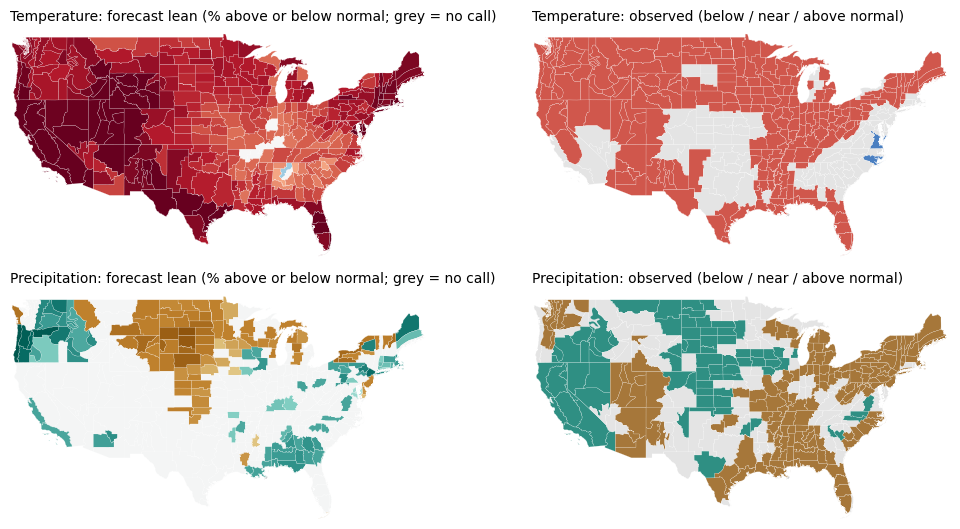
73% of calls verified · 0% came out the opposite way · calls made over 99% of the country · observed: 0% below, 29% near, 70% above normal
24% of calls verified · 43% came out the opposite way · calls made over 38% of the country · observed: 39% below, 31% near, 30% above normal
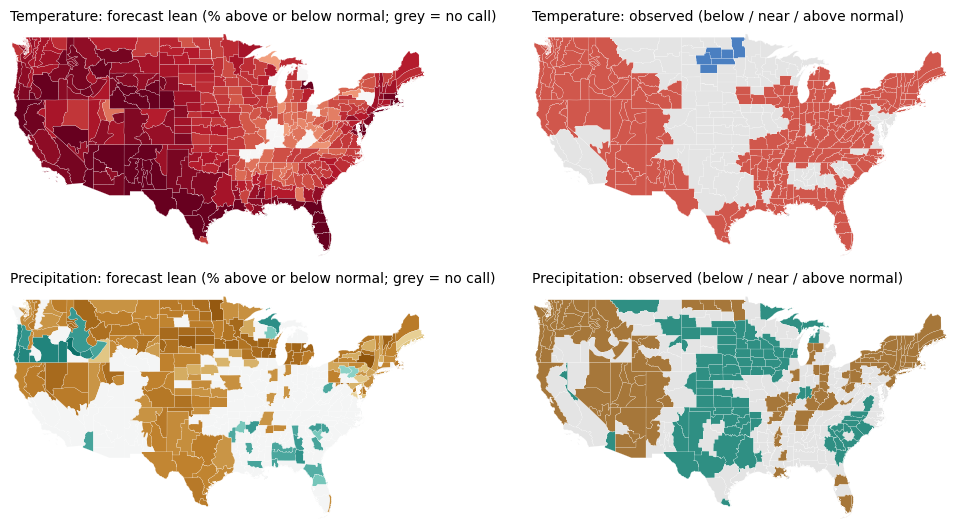
56% of calls verified · 2% came out the opposite way · calls made over 97% of the country · observed: 2% below, 39% near, 59% above normal
30% of calls verified · 31% came out the opposite way · calls made over 61% of the country · observed: 33% below, 40% near, 27% above normal
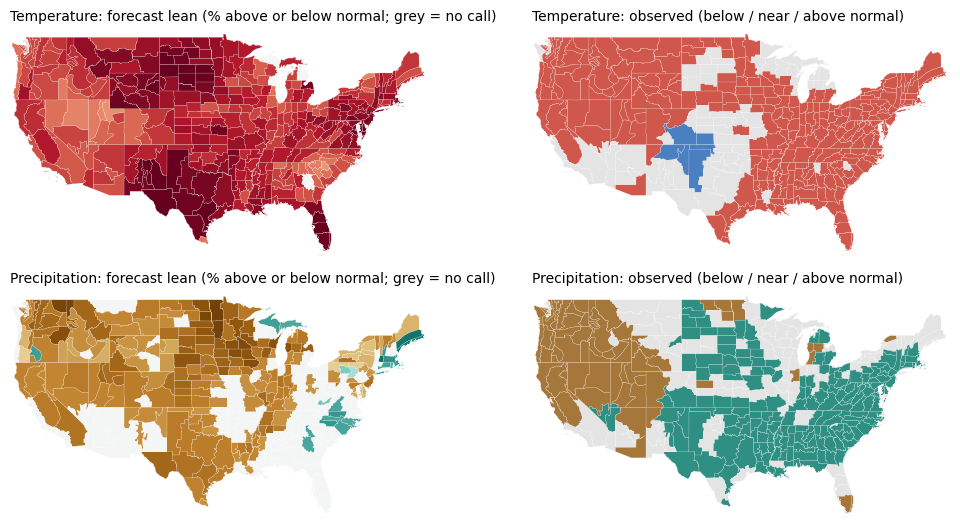
65% of calls verified · 4% came out the opposite way · calls made over 99% of the country · observed: 4% below, 25% near, 71% above normal
35% of calls verified · 34% came out the opposite way · calls made over 72% of the country · observed: 27% below, 28% near, 45% above normal
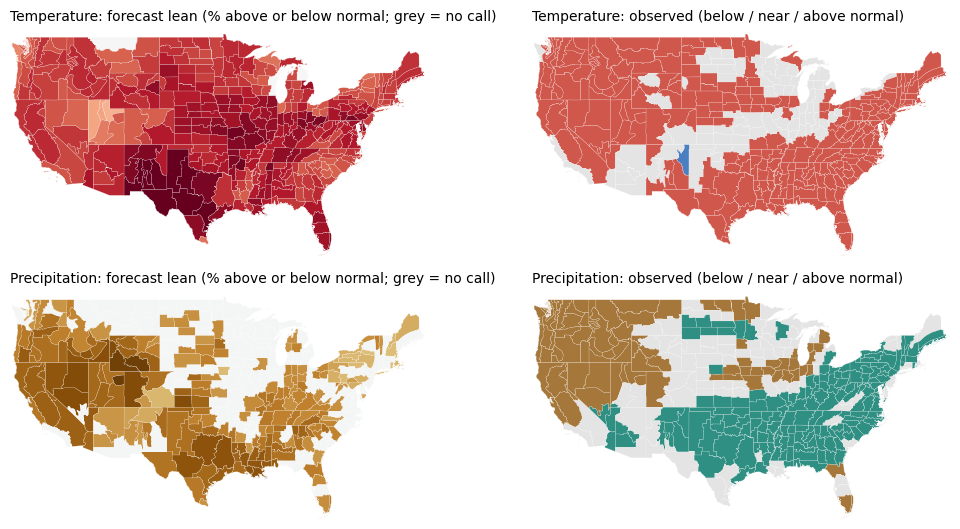
73% of calls verified · 0% came out the opposite way · calls made over 99% of the country · observed: 0% below, 24% near, 75% above normal
36% of calls verified · 37% came out the opposite way · calls made over 67% of the country · observed: 30% below, 30% near, 40% above normal
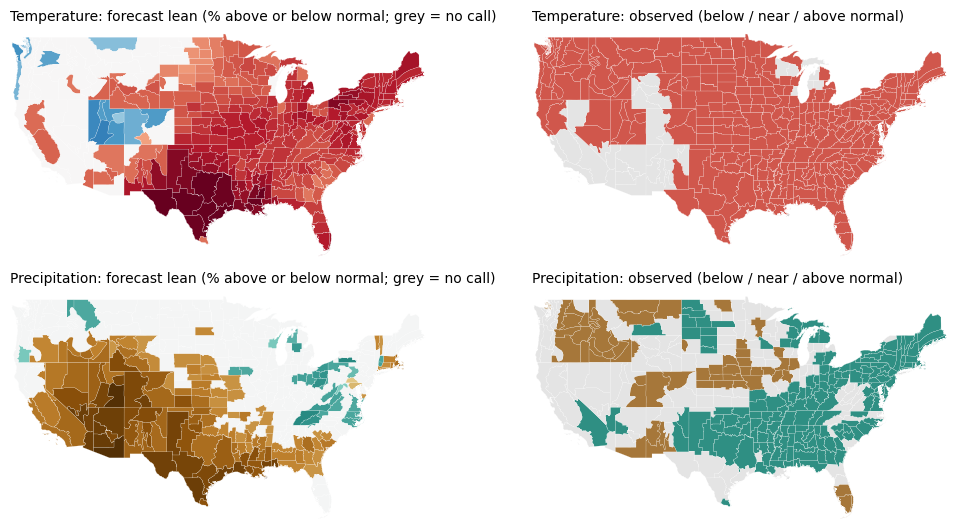
76% of calls verified · 5% came out the opposite way · calls made over 76% of the country · observed: 0% below, 17% near, 83% above normal
22% of calls verified · 32% came out the opposite way · calls made over 58% of the country · observed: 20% below, 41% near, 39% above normal
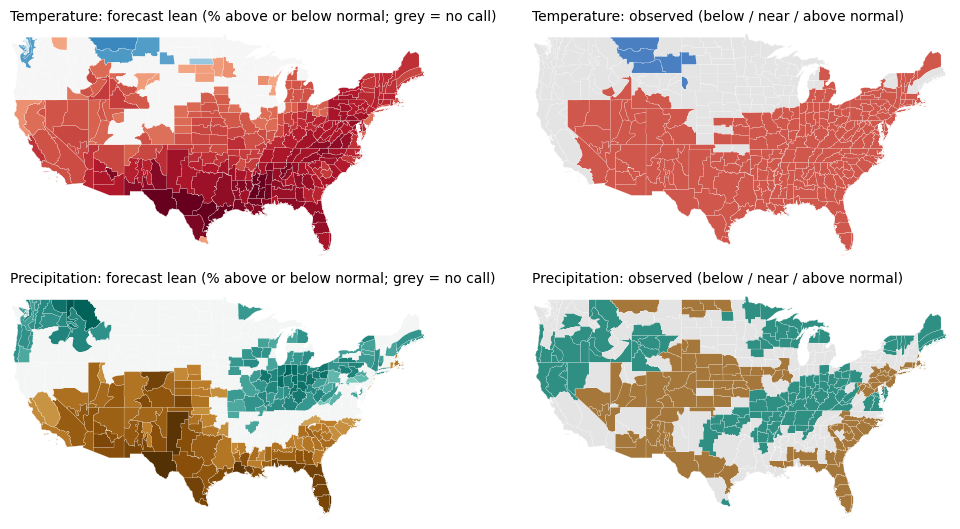
85% of calls verified · 0% came out the opposite way · calls made over 77% of the country · observed: 3% below, 34% near, 63% above normal
57% of calls verified · 5% came out the opposite way · calls made over 62% of the country · observed: 32% below, 38% near, 30% above normal
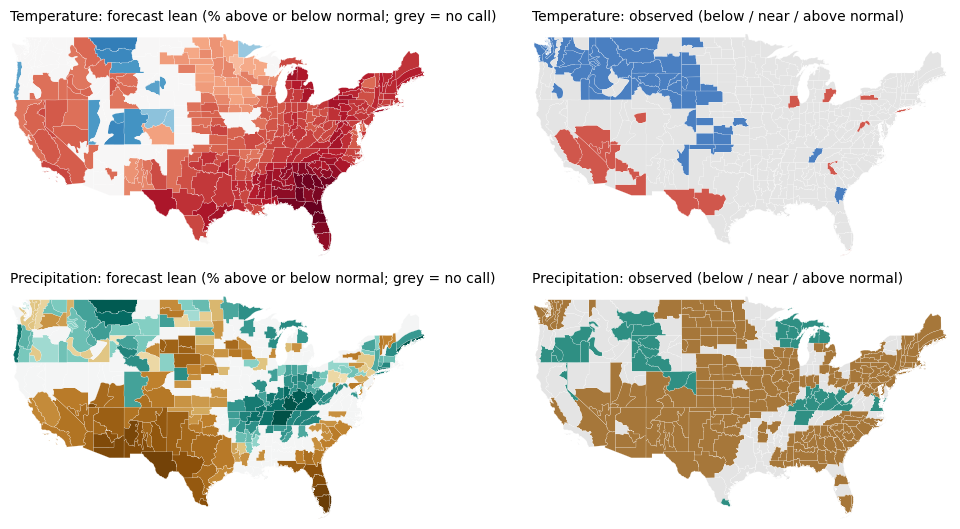
28% of calls verified · 7% came out the opposite way · calls made over 78% of the country · observed: 18% below, 73% near, 9% above normal
58% of calls verified · 10% came out the opposite way · calls made over 74% of the country · observed: 57% below, 30% near, 12% above normal