
Amphibian Outlook · November 2026
A warm North and a cool, wet South this winter
NOAA's Climate Prediction Center released its new seasonal outlook on November 19, 2026. Here is ours for December to February, next to NOAA's, with our record beside theirs so you can judge both yourself. The Pacific is in a strong El Niño that is still strengthening, and the usual El Niño pattern is on the map: mild across the North, with the storm track pushed south.
December, January and February · 0.5-month lead
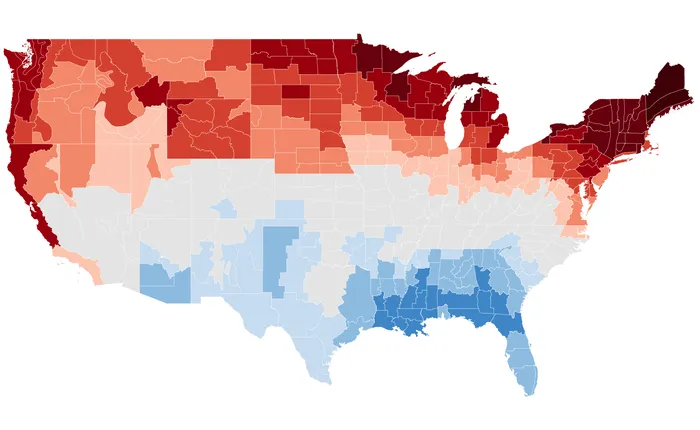
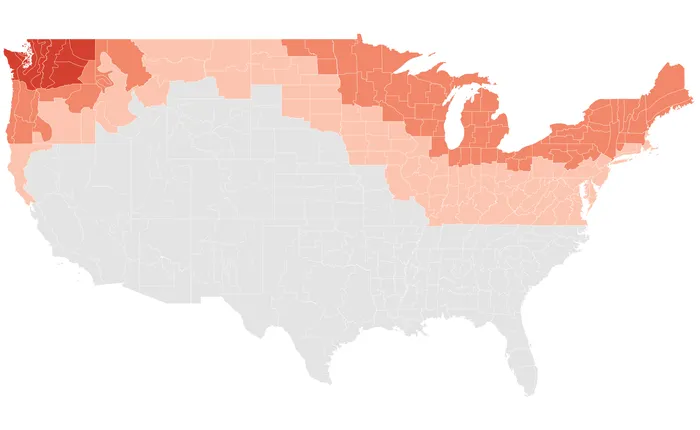
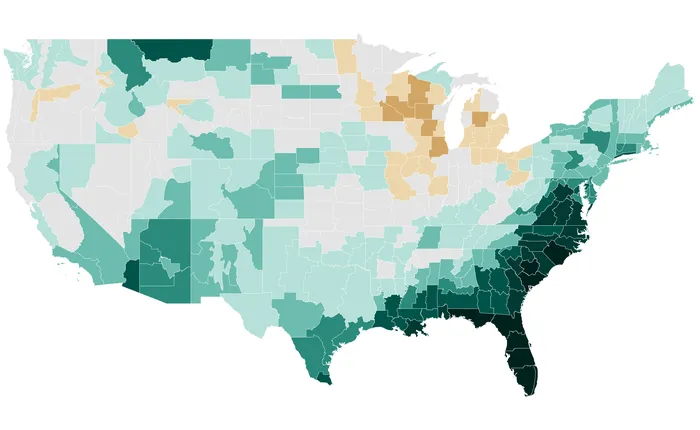
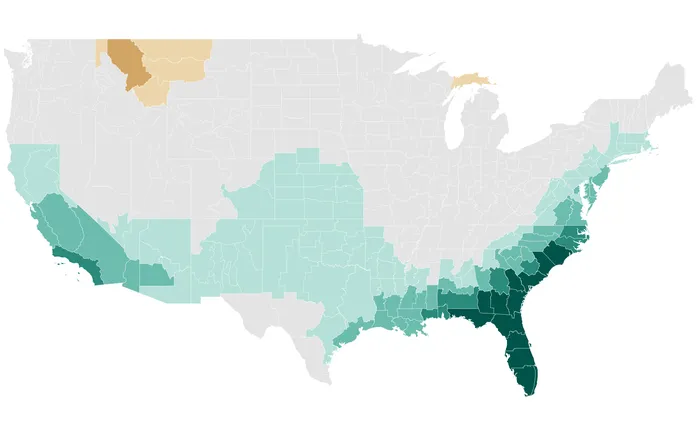
Each of the 344 NOAA climate divisions gets a probability for below, near and above normal against its own 1991–2020 record. Color gives the probability of the favored category where it reaches 40% or more, in steps of 10 up to 90% or more; gray means near normal is favored or there is no clear lean. "Favored" means the most likely of three, not a promise.
Region by region
- Northeast: warm, the map’s firmest lean (78%); wet.
- Upper Midwest: warm, about 2 in 3 odds; slightly dry.
- Ohio Valley: no clear lean, then warm and wet by Jan–Mar.
- Southeast: the wettest lean on the map (79%, then 62%); cool.
- Northern Rockies and Plains: warm (64%, then 61%); slightly wet.
- South: cool and wet in midwinter; milder by Jan–Mar.
- Southwest: wet in both seasons; near normal, then warm.
- Northwest: warm (60%, then 65%); no precipitation lean.
- West: mild; a slight wet lean, firmer by Jan–Mar.
In the full November issue
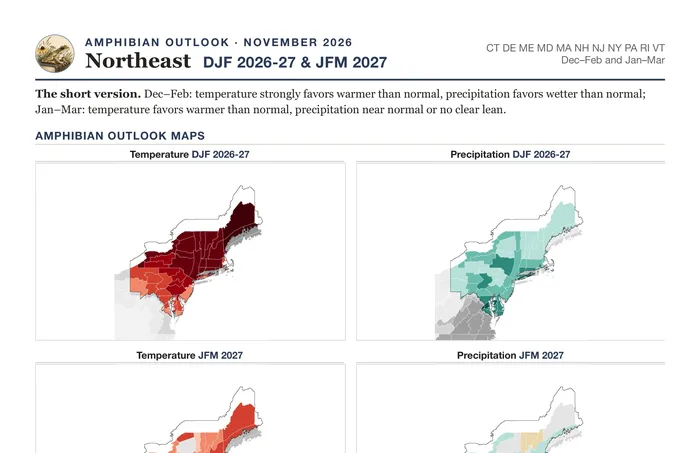
- A page for each of nine regions: maps for both seasons, the odds beside NOAA’s, and what it means outside for gardens, ponds, snow cover, trails and wildlife.
- January to March as well as December to February, with where the two outlooks differ.
- A Corn Belt and Plains farm edition: the odds by crop region and where drought stands now.
- Full-size printable maps for both seasons, with legends and scale.
Get the full issue See sample pages
Your first issue is free, then $5 a month, or $50 a year (two months free).
Our record, next to NOAA's
| Temperature | Precipitation | |||
|---|---|---|---|---|
| Amphibian Outlook | NOAA CPC | Amphibian Outlook | NOAA CPC | |
| Skill score | 25.1 | 15.3 | 6.7 | 3.2 |
| How much of the map gets a call | 93% | 56% | 68% | 22% |
| Accuracy where both made a call | 65.0% | 64.3% | 53.6% | 49.8% |
Skill score: the ranked probability skill score times 100, against climatology (an even one-in-three chance): 0 is no better than climatology, 100 is perfect. Area-weighted over all 344 divisions and averaged over 116 seasons, forecasts issued 2017 to 2026, with NOAA scored the same way. Most of the difference comes from giving a call over more of the map; where both outlooks make one, they are about level on temperature and ours is 4 points more accurate on precipitation. Every season is scored publicly: see how every season verified.
Regardless of the outlook
- Frost dates for your state and the length of each day: frost dates, field almanac.
- Geminids peak the night of Dec 13 to 14; Cold Moon, the year's closest, the evening of Dec 23; Wolf Moon, the closest full moon of 2027, Jan 22. Tonight's moon.
- Nature guides for all 50 states this month, each with a free printable checklist: nature this month.
Amphibian Outlook is an independent product of Amphibian Publishing, written by a meteorologist with a PhD. It is not affiliated with or endorsed by NOAA or the National Weather Service. NOAA CPC maps and probabilities are U.S. government products, shown for comparison. For watches and warnings, see weather.gov. Contains modified Copernicus Climate Change Service information 2026. Neither the European Commission nor ECMWF is responsible for any use that may be made of the Copernicus information or data it contains.